A “bear market” is traditionally defined as a peak-to-trough decline in value of -20% or more. Based on that definition, the only way you can tell that a bear market exists, is after it has already happened.
At this date, most of the major US equity indexes have not dropped by the arbitrary -20% measure that traditionally defines a bear market. Through Friday’s close, the S&P 500 was off about-12% from its high, which would be 8% short of the “bear market” threshold.
Here is something to think about. Since most markets have not yet dropped by -20%, then does that mean that we are NOT in a “bear market?”
Bear markets have five primary characteristics:
- The changes in pricing will typically form a downward stair step pattern of lower lows (in price) followed by lower highs
- The price volatility will be high or increasing.
- Price will break below its 200-day moving average.
- Enough time should pass to allow investors to experience a significant change in their beliefs regarding price. Most investors will become emotional and will believe that prices will continue to drop much lower.
- The markets’ direction will become very counterintuitive. In other words, the value is likely to rebound when investors are the most pessimistic. When investors begin to regain hope, following a short-term rebound, then the markets are likely to turn back down again.
I can remember back in March of 2020. One news anchor stated something along the lines of this: “If the market falls another one quarter of a percent, we will officially be in a bear market.” In other words, once the S&P 500 blew past the -20% marker, did that mean that we were in a conventional wisdom “bear market?” The answer is “no.” The markets became highly inefficient because emotional short-term sellers swamped buyers. The many sellers caused a very sharp decline. We call such an action a “trading anomaly.” There were no buyers to purchase the wave of emotional sellers. The net result was that the madness of crowds came face to face with the law of supply and demand. The pandemic caused a knee-jerk emotional reaction from investors, which we call a “trading anomaly.” On the other hand, bear markets last longer and can take months or even years to resolve themselves.
Bear markets have high volatility which is the result of a breakdown in the normal low or random correlations that typically exist in a diversified portfolio of securities. Instead, securities begin to move together causing a loss in the benefit of diversification which in turn, causes an increase in portfolio volatility. Volatility shows itself in a cluster of “outlier” days, which Canterbury defines as a trading day beyond +/-1.50%.
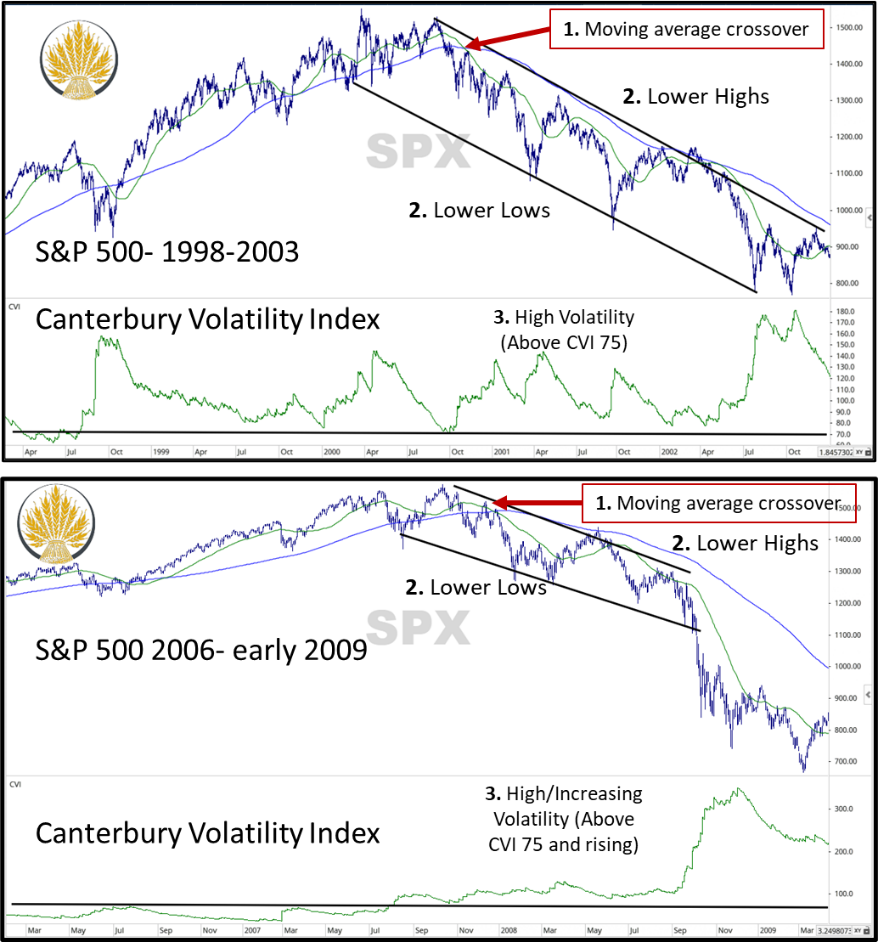
Next, I will show some examples of typical bear market behavior. Two good examples of bear markets include the technology crash of the early 2000s and the 2008 financial crisis. These two charts can be found below. On each chart, I have labeled the similar characteristics that are shared between them:
- Moving Average Crossover between the 50-day moving average and the 200-day moving average of price. Moving averages often behave as support and resistance. Bull markets will have the opposite characteristic with the shorter-term average above the long-term moving average. The crossing over of the two is sometimes called a “death cross.”
- Series of lower lows and lower highs— You can see that both charts follow a declining stair-step pattern. As stated above, bear markets have many strong short-term rallies. Each rally is followed by a new low which continues the bear market.
- High/increasing volatility— Both charts show increasing volatility prior to the upcoming bear market. You can see this in the case of the 2000 Tech wreck. The market was rising while volatility was already high (above CVI 75). A similar event occurred preceding the financial crisis, in that volatility began increasing (got above CVI 75) prior to a major decline.
Volatility and substantial declines are killers of long-term compounding of returns. From the time that the S&P 500 registered a high in 2000, it took until 2007 to get back to breakeven. Then what followed was another bear market in 2008 and along with it another -50%+ decline. The net result was that it took until 2013 to get back to where it was 13 years prior.
Observations Regarding the Current Market Environment:
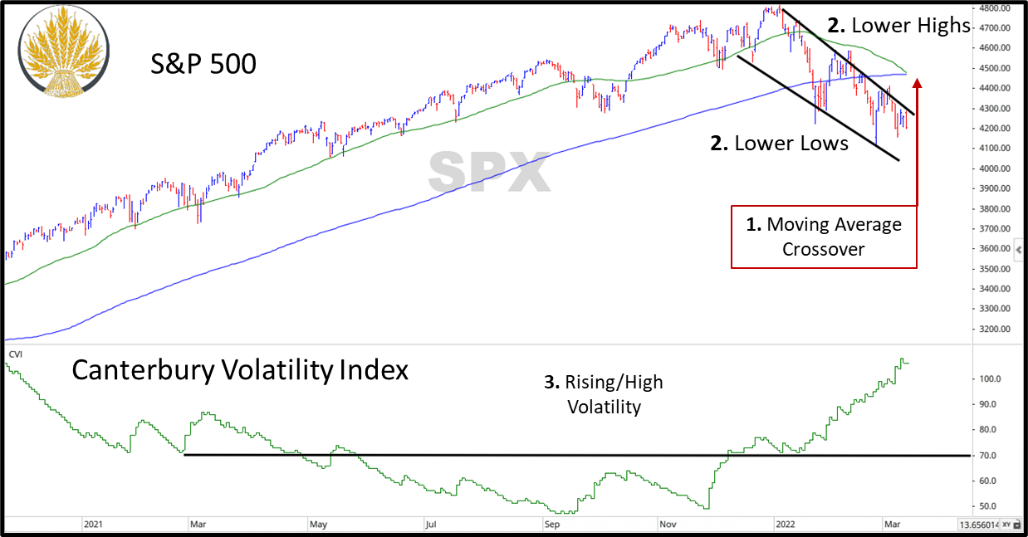
So, now that we have established a few bear market basics, let’s look at the market today, with some statistics.
- The 50-day and 200-day Moving Average of Price is about to crossover, which is a “death cross.” Again, this alone does not mean that the current drop will be followed by a major decline, but when coupled with other technical indicators, this is a bad sign.
- Over the past 2 months, the market has put in a series of lower lows and lower highs. Each rally in the market has ultimately fallen short of a previous high and fallen lower. So far, the sample size of declines and rallies are small, but not insignificant
- Volatility is high and is increasing. Volatility reached a low point late in 2021 of CVI 48. Since then, it has more than doubled, rising to CVI 106. This rapid increase in volatility is a negative sign for the markets. Remember, all bear markets are volatile. As a side note, volatility had been high during 2020, but had fallen significantly heading into 2021. Notice that when volatility is decreasing, the market is moving in an “orderly” fashion.
- We mentioned outlier days, which are defined as a trading day beyond +/-1.5%. In the last 6 months of 2021, there were only 10 outlier days. So far, in the first 2.5 months of 2022, we have seen 17 outlier days and a few more that came close to qualifying. One third of the trading days this year have been outliers.
The charts above are just showing large cap S&P 500 index, which happens to be off by more than -12% from its peak. What has not been discussed is that the Nasdaq Index is off by -21% from its peak, the Emerging Markets index is down -27% from its peak, the EAFE is down -16%, and 20-year treasury bonds are off by -25% from their high back in August of 2020. When you look at the Russell 3000 index, which represents the majority of US stocks both large and small, 52% of stocks are off by at least -20% from their respective high, and 26% are off by -40% or more. So, while things have looked grim for the S&P 500, other indexes have seen much worse already.
Bottom Line
Are we entering a bear market?
According to Canterbury’s Market State ratings, we have been in a bear market for more than half of this year. We know this even though we have not experienced an arbitrary -20% decline in the S&P 500. The markets have been volatile. Be aware that bear markets are counterintuitive. In other words, the markets will do whatever they need to, in order to confuse the masses. You will often see sharp bear market rallies, followed by another large decline. Many times, the rally will be led by the former weakest market segments. Make no mistake, we are in a high-risk environment.
Fortunately, this is the type of market where an Adaptive Portfolio Strategy benefits the most. There are areas of this market that have not had the same negative impact as others, such as commodities, Consumer Staples, and the energy sector. We also use inverse securities that move in the opposite direction of its underlying index. Inverse funds are great tools for risk management during volatile periods. An adaptive portfolio will use whatever combination of securities necessary to produce and maintain the most efficient, low volatility, portfolio that matches the existing market environment, bull or bear.