

By Chris Hausman, Swan Global Investments
If 2017 was “the best of times,” then February 2018 was “the worst of times”—at least in the volatility markets. During the first week of February what was previously all quiet on the volatility front quickly turned to “Volmageddon.” Market participants who had been lulled for so long with the low volatility environment of 2017 were reminded how quickly things can change. In “A Tale of Two Volatilities, Part 1,” we explored how option implied volatility can actually rise when the market is moving quickly higher and setting new highs. This follow-up will evaluate what occurred the first week of February 2018, how volatility strategies fared, and the new volatility regime we have now entered.
February Skew Overview
On February 5, 2018, on the heels of rising rate expectations, the S&P 500 dropped 4.1% recording its largest one-day move since 2011. This ended 300 trading days without a downward move of more than -2% in the index. The VIX, in turn, recorded its largest-ever percentage increase (115%) closing at 37.32 from the previous day’s close at 17.31. Additionally, stock correlations increased and reached their highest levels since August 2015.
Related: Do Low Volatility Strategies Have Anything New to Offer?
Let’s begin by examining what happened to the volatility skew as the market sold off in early February. Remember from Part 1 that skew is the relative difference in pricing between downside strikes (moneyness less than 100%) and upside strikes (moneyness greater than 100%). The general theme in January was that of a declining skew as investors implemented stock replacement strategies via upside calls and overwriters were forced to cover their short call positions due to the speed of the market’s rally. The demand for upside calls increased with a rapidly rising market.
Things reversed dramatically in February. The graph below compares the skew curve from January 26 to the shape of the same skew curve from February 8, 2018.
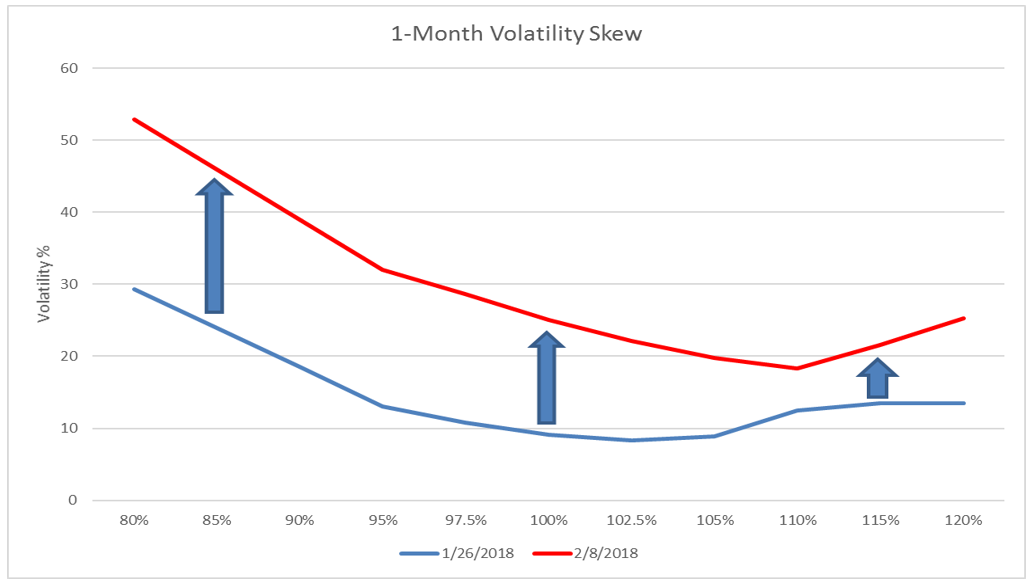
Source: Bloomberg, Swan Global Investments
The graph above shows two things. First, there was an increase in overall volatility. This equates to ALL options increasing in value as a function of increased demand for option premium across the spectrum. Secondly, there was a marked increase in skew. In other words, not only was there an increase in demand across the board for option premium, but there was a relative increase in demand for downside puts as investors rushed to purchase protection as the markets sold off.
To showcase this further, the 25-delta put-call skew we saw on January 26 had traded in the 22nd percentile over the last 5 years. Meaning, over the last 5 years, 78% of all observations had skew trading higher. On February 8, 2018, that percentile had increased to the 100th percentile.
The Worst of Times for Risk Control Strategies
So, what was the cause of the extreme movement in volatility? First, there was a deleveraging from the risk control/risk parity community. These strategies target a specific volatility or equity ratio and must rebalance their portfolios with market movements. For example, a short gamma strategy must buy volatility as volatility is increasing or sell equities as equities are decreasing. As we witnessed, these moves can happen extremely quickly and have costly effects
On February 5, inverse short VIX products were forced to rebalance their portfolios near the market close and in the after-hours market. This can result in a costly rebalance. For instance, suppose you have a $100 portfolio and you want short VIX exposure with 1x leverage. This requires selling $100 of VIX futures. Now suppose the VIX increases and the exposure is now $150. The short VIX portfolio is now worth only $50 making you 3x levered. To de-lever, the portfolio requires purchasing $100 of risk to maintain the 1x exposure desired. The more the VIX increased, the more risk needs to be purchased to maintain the desired exposure.