It’s an odd sight to see. The pandemic is almost in the rearview as vaccines continue to roll out and mandates are eased or even lifted in some cases. At its peak, the unemployment rate in the US was around 14%. Today, that number stands at a little over 6%. While experts estimated that nonfarm payroll employment could increase by as much 1,000,000 in April, those estimates completely missed the mark; nonfarm payroll employment only increased by 266,000 last month.
Take a drive around town. I went by a Burger King and McDonalds both with “help wanted” signs displayed offering $13/hour wages. Chipotle wasn’t even accepting walk-up orders as they did not have the staff to fulfill them (you had to order online ahead of time). In fact, last week, Chipotle raised their minimum wage to $15/hour at 2,800 hundred locations to attract workers. Amazon announced they were offering $1,000 signing bonuses at an average pay of $17/hour. With the current unemployment benefits, people just don’t want to go back to work.
Source: WSJ: Amazon, McDonald’s, Others Woo Scarce Hourly Workers With Higher Pay
What does that mean for the markets? Well, right now, it hasn’t appeared to affect them in any major way. Until the technical characteristics of the market begin to change, the market remains in a low volatility state.
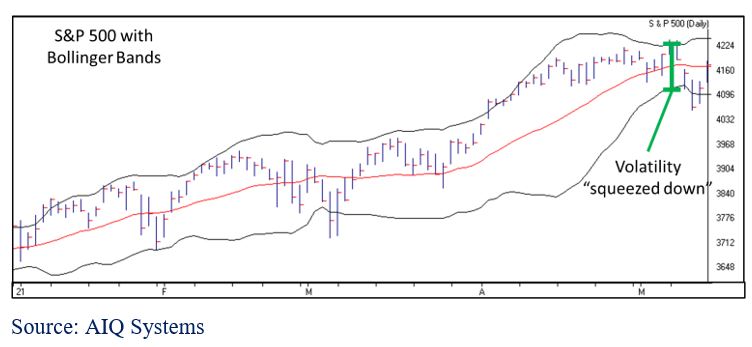
The S&P 500 experienced a few “outlier” days (a trading day beyond +/-1.50%) last week. A -2% down day was followed by +1.00% and +1.50% up days. The news cycle attributed the outlier down day to “downbeat remarks from the federal reserve.” Was it that, or was it expected?
The market’s volatility was getting squeezed down. Similar to pinching a spring, eventually you’re bound to see some sort of “pop.” One easy way to visualize the compression of volatility, is by looking at Bollinger Bands. Without getting too technical, Bollinger Bands look at how wide the daily fluctuations of market are, or standard deviation. There is an upper and lower band, centered around a short-term moving average of the market’s value. When the upper and lower bands are expanded, daily fluctuations have been wider; when they are close, market fluctuations have been tighter. You can see in the chart below, that up until last week, volatility in the markets had been compressed:
Right now, we are seeing normal market fluctuations. Volatility reached a bottleneck and expanded as a result. The event that supposedly caused the expansion is unimportant.
As an additional point, we have discussed that technology-related stocks have been lagging other market sectors, which has been rare for the past 10 years. The “pop” in volatility we saw last week was led by technology-related, which has been par for the course so far this year.
Market Leadership
Style Indexes
We know from previous updates that Value is leading Growth across the board. What is particularly odd is that when looking at 6 style indexes (large cap, mid cap, small cap—growth & value), large cap value has the best risk adjusted ranking. On the other hand, large cap growth has the worst risk adjusted rank. In other words, while large caps show strength in value amongst comparable indexes, large caps have been weak in growth.
Commodities
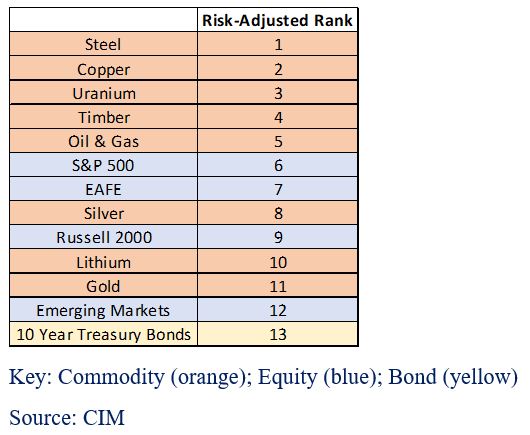
Many are aware of the prices surging as the colonial pipeline was temporarily closed, and anyone who has tried a home remodel recently will know that lumber prices are through the roof. Commodities have been a hot area in the markets recently. The table below table shows the risk-adjusted rankings of a select few commodity indexes along with some equities and 10-year treasury bonds. As a note, you will see commodities are showing leadership. Gold, which has struggled up until last month, is starting to rise up our risk-adjusted ranking.
Bottom Line
The trend continues as value leads growth, large technology stocks continue to underperform, and commodities lead in relative strength. The outlier days we experienced in the markets last week don’t indicate any concerns just yet. We are still in a bullish Market State as risk remains relatively low. Fundamentally, I am sure there are many concerns that exist: people staying unemployed, companies struggling to hire workers, and it’s hard to imagine home valuations and commodities stay this hot. Fortunately, fundamentals don’t make or break markets. Markets are driven by supply and demand.
No one can see into the future and make an accurate call to the market’s direction. What we can do, is look at the current technical characteristics in the markets, and determine whether it is risky or not. Today, the markets have low risk. Should risk begin to rise, we can utilize adaptive portfolio management to adjust our allocations and holdings to deal with a new environment.