Housing investments account for 15% of U.S. GDP and are a large component of both CPI and PCE, two inflation measures investors watch closely. The following charts illustrate how the housing market continues to recover, likely over the next couple of years, albeit at a more moderate pace.
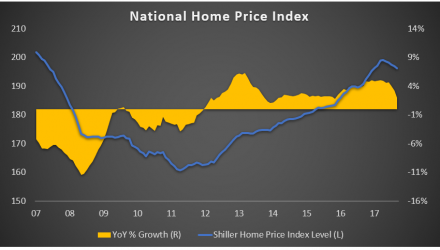
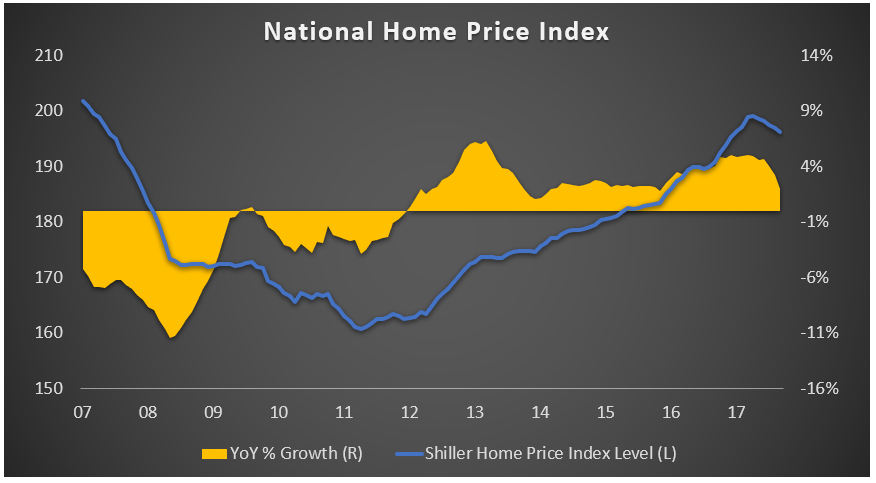
1. Home prices hit their bottom in 2011 and have since steadily appreciated; however, the growth rate has slowed due to changes in the tax code for mortgage deductions and, more importantly, rising interest rates.
2. Despite a strong job market, workers are not experiencing enough of an increase in wages to counter a rise in home prices and mortgage rates. As a result, affordability is getting stretched in many markets.

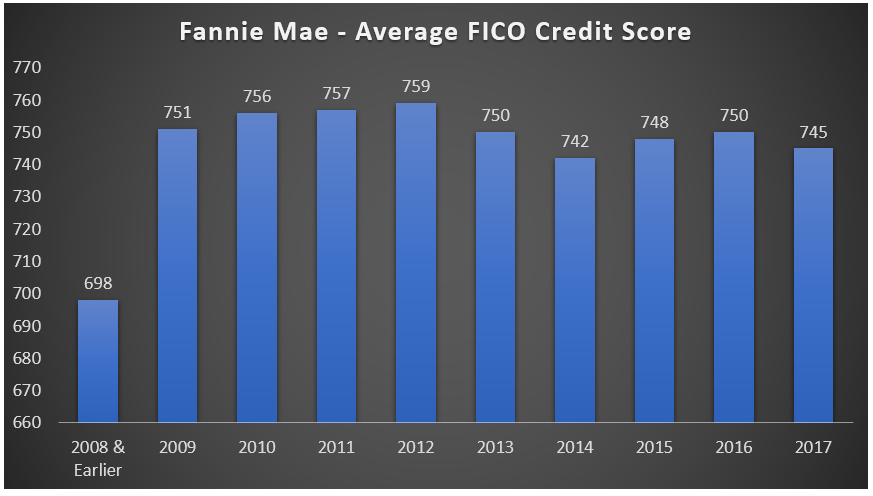
3. The good news is that we are not on the verge of another housing crisis. Borrowers are in a much better position today than they were pre-crisis. For instance, between 2005 and 2008, the average credit score on Fannie Mae’s conventional loans was 696. This increased to 752 for the years between 2009 and 2015, and in 2018 currently sits at 742.