

While Not Unanimous, the Overall Trend Continues
By Hafeez Esmail, Main Management
Last Friday the first estimate for Q1 2019 GDP was released. It handily beat expectations, coming in at 3.17% annualized while forecasts were calling for a 2.5% annualized rate. We are now just one month away from tying the longest economic expansion since World War II. The current expansion has run for 119 months and is just short of what was experienced from 1991 to 2001. It appears likely that we will surpass this mark.

One of the reasons for the longevity of this recovery has been its slow and steady trajectory. As you can see from the chart below, it’s the slowest recovery in decades but is about to become the longest. For some perspective, the 1991-2001 recovery grew to 411 from a base of 100 while the current recovery is only at 232.

On the surface one may assume that the prolonged economic expansion translates directly into strength in the housing market. The reality is less straightforward. Existing home sales dropped by -4.9% month over month in March, the biggest monthly decline since February 2016. Moreover, on a year-over-year basis, existing home sales were down -7.0% in March. This decline was the 13th in a row, the longest negative streak since 2009.
New home sales paint a more optimistic picture. They were up +4.5% month-over-month in March, the third straight month of gains. In addition, on a year over year basis, new home sales are up +3.0%, posting a positive year-over-year number for the first time since August 2018. New home sales rose to a seasonally adjusted annual rate of 692,000 in March, the fastest since November 2017. These are among the reasons that Main Management currently maintains a positive view of the home construction sector of the U.S. equity market. ETFs such as the iShares U.S. Home Construction ETF (ITB) or SPDR S&P Homebuilders ETF (XHB) may benefit from the promising trend in this segment.
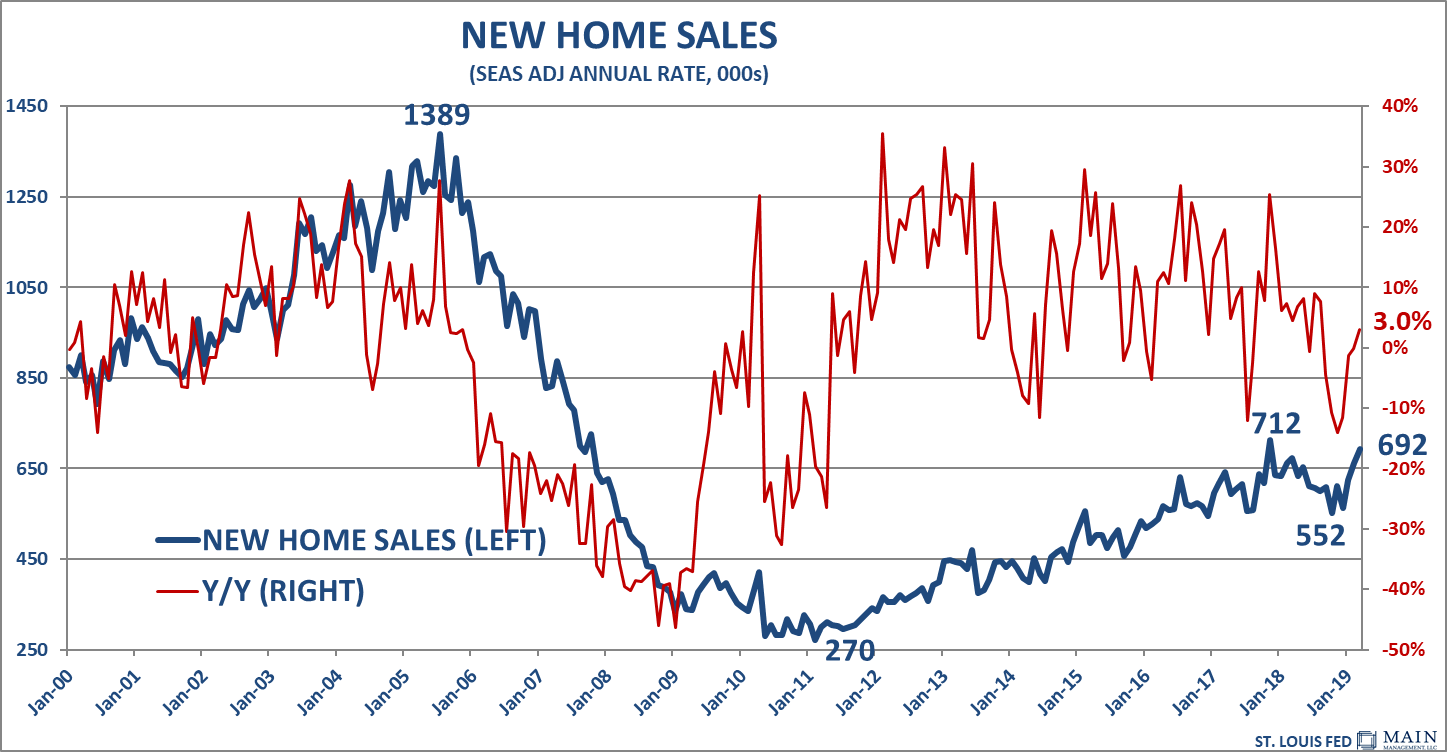
The monthly supply of new homes fell to 6.0 months, the lowest it has been since June 2018, while the monthly supply of existing homes rose to 3.9 months. A six-to-seven month supply is viewed as a healthy balance between supply and demand. The monthly supply is a measure of how long it would take to exhaust the current inventory.
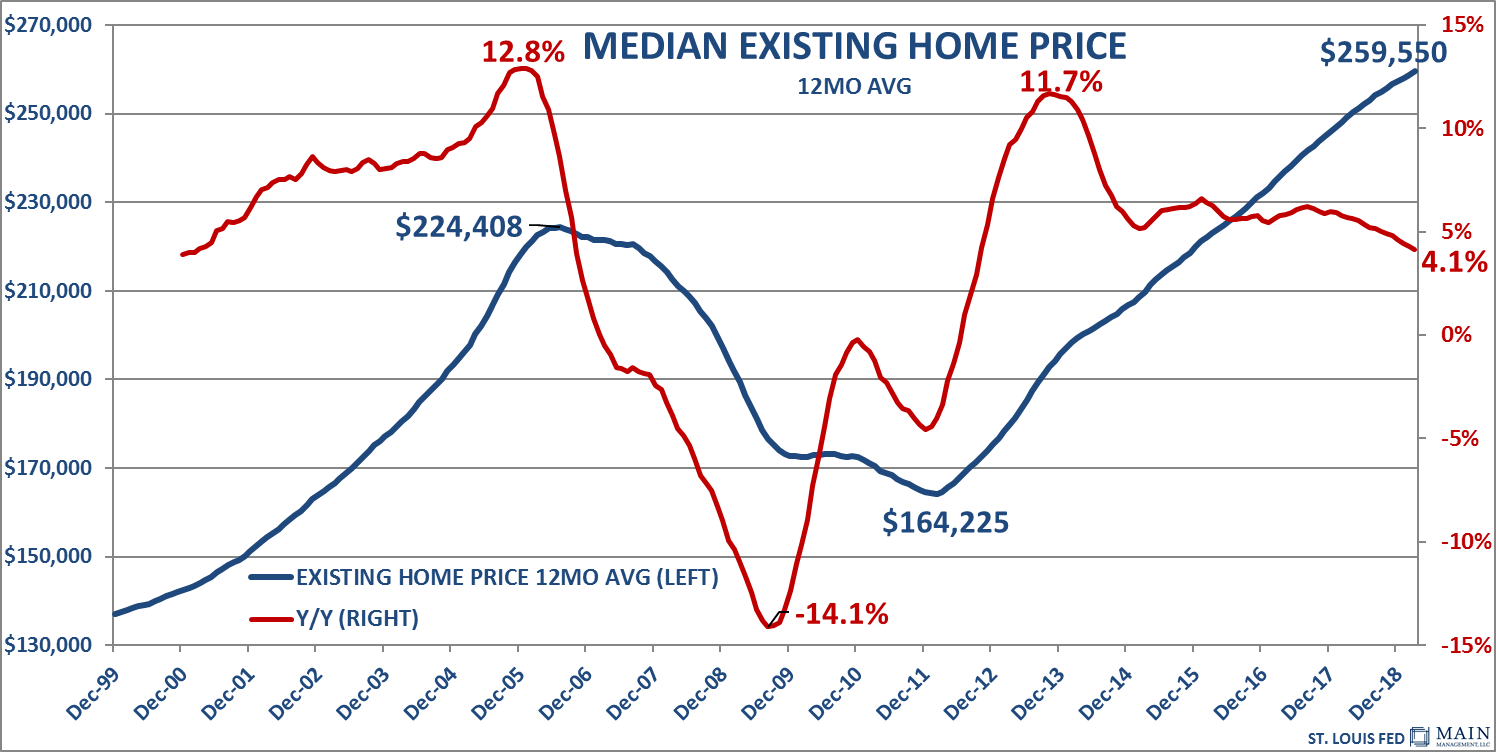
The median existing home price moved higher to $259,400 in March, up +3.8% from a year ago. There is clearly some seasonality going on with prices. However, looking at the year-over-year number, it is clear that the pace of price increases continues to slow. To smooth out the seasonality effects, the chart below illustrates the 12-month rolling average. This number has been steadily increasing but the pace of the increases has slowed considerably over the past couple years. The 12-month average was up +4.1% in March, the slowest gain since September 2012.
Similarly, the Case-Shiller 20 City Home Price Index rose to 214.6 in January, a number that’s up 3.5% from January 2018. However, although prices are rising, the overall rate that home prices are going up year-over-year is slowing down. One possible tailwind for pricing may be the Federal Reserve’s decision to pause interest rate hikes, a move that has brought about a decline in the 30-year mortgage rate. As of the end of March it was 4.27%, down -3.8% year-over-year. Lower mortgage rates improve home affordability.
The US Homeownership Rate, which declined to 64.2% in Q1 2019, is below the trailing 50-year average of 64.8%. Accordingly, there appears still to be a sizable number of first-time home buyers wanting to enter the market. A host of homebuilders are focusing their current projects on this segment. So, although the overall market for home sales is slowing, new homes may continue to be the bright spot.
Hafeez Esmail is Chief Compliance Officer at Main Management, a participant in the ETF Strategist Channel.
A pioneer in managing all-ETF portfolios, Main Management LLC is committed to delivering liquid, transparent and cost-effective investment solutions. By combining asset allocation insights with smart implementation vehicles, Main Management offers a unique approach that translates into distinct advantages for our clients, including diversification, cost efficiency, tax awareness and transparency. http://www.mainmgt.com.