
By Justin Sibears, Newfound Research
Can the monetary policy environment be used to predict global equity market returns? Should we overweight/buy countries with expansionary monetary policy and underweight/sell countries with contractionary monetary policy?
Such are the softball questions that our readers tend to send in.
Intuitively, it’s clear that monetary policy has some type of impact on equity returns. After all, if the Fed raised rates to 10% tomorrow, that would clearly impact stocks.
The more pertinent question though is if these impacts always tend to be in one direction. It’s relatively straightforward to build a narrative around why this could be the case. After all, the Fed’s primary tool to manage its unemployment and inflation mandates is the discount rate. Typically, we think about the Fed hiking interest rates when the economy gets “too hot” and cutting them when it gets “too cold.” If hiking (cutting) rates has the goal of slowing (stimulating) the economy, it’s plausible to think that equity returns would be pushed lower (higher).
There are a number of good academic papers on the subject. Ioannadis and Kontonikas (2006) is a good place to start. The paper investigates the impact of monetary policy shifts on equity returns in thirteen OECD countries [1] from 1972 to 2002.
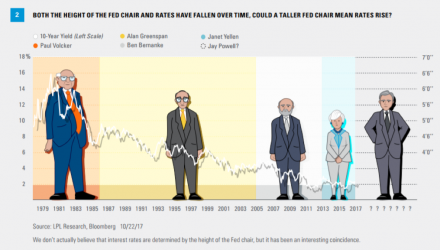
Their analysis can be split into two parts. First, they explore whether there is a contemporaneous relationship between equity returns and short-term interest rates (i.e. how do equity returns respond to interest rate changes?) [2]. If there is a relationship, are returns likely to be higher or lower in months where rates increase?
![]()
Source: “Monetary Policy and the Stock Market: Some International Evidence” by Ioannadis and Kontonikas (2006).
In twelve of the thirteen countries, there is a negative relationship between interest rate changes and equity returns. Equity returns tend to be lower in months where short-term rates increase. The relationship is statistically significant at the 5% level in eight of the countries, including the United States.
While these results are interesting, they aren’t of much direct use for investors because, as mentioned earlier, they are contemporaneous. Knowing that equity returns are lower in months where short-term interest rates rise is actionable only if we can accurately predict the interest rate movements ahead of time.
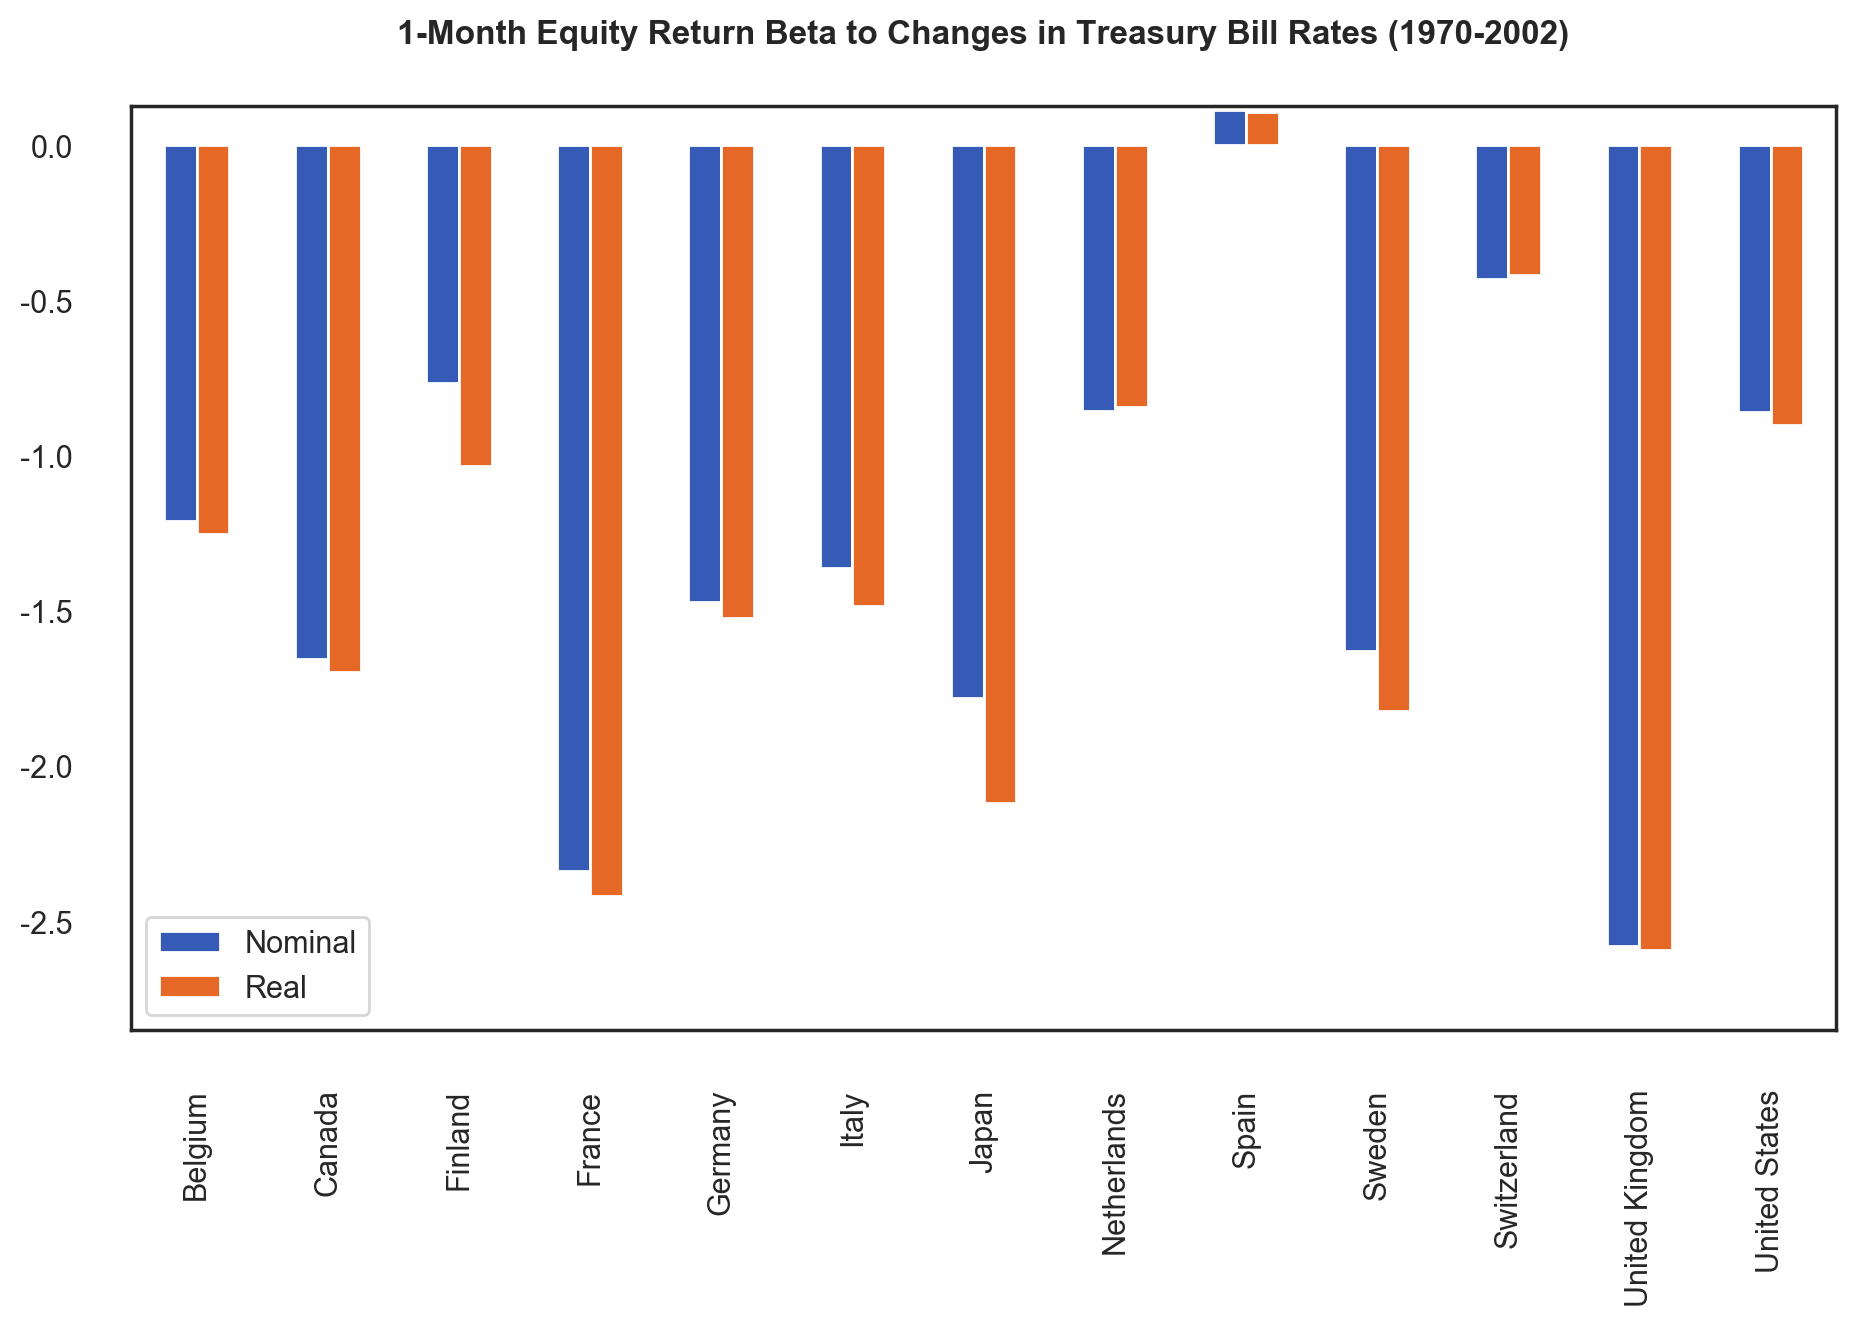
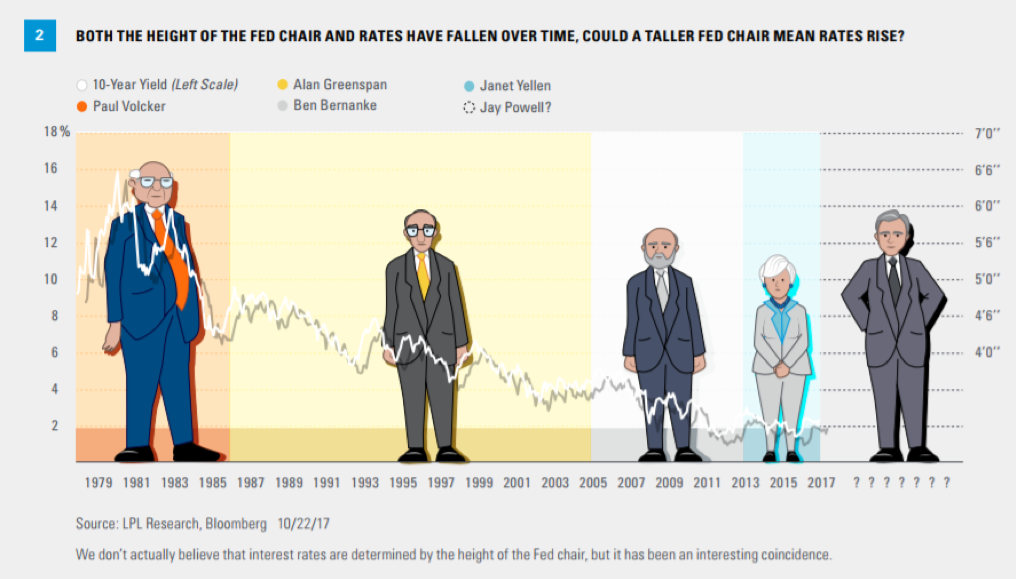
As an aside, if there is one predictive interest rate model we subscribe to, it’s that height matters.
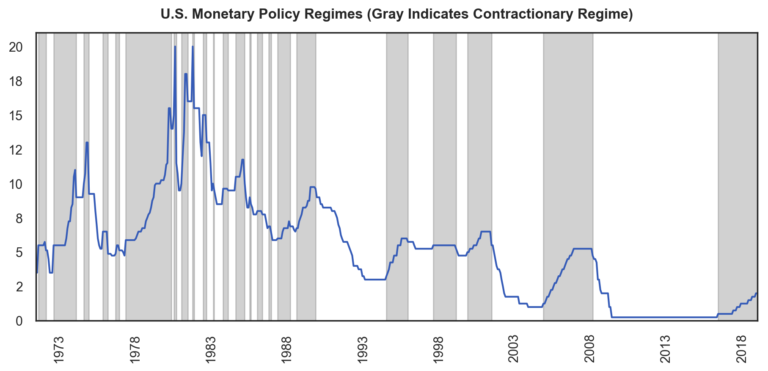
Fortunately, this is where the authors’ second avenue of analysis comes into play. In this section, they first classify each month as being part of either a contractionary or an expansionary monetary policy regime. A month is part of a contractionary regime if the last change in the discount rate was positive (i.e. the last action by that country’s central bank was a hike). Similarly, a month is part of an expansionary regime if the last central bank action was a rate cut.
We illustrate this classification for the United States below. Orange shading indicates contractionary regimes and gray shading indicates expansionary regimes.
The authors then regress monthly equity returns on a dummy variable representing which regime a month belongs to. Importantly, this is not a contemporaneous analysis: we know whether the last rate change was positive or negative heading into the month. Quoting the paper:
“The estimated beta coefficients associated with the local monetary environment variable are negative and statistically significant in six countries (Finland, France, Italy, Switzerland, UK, US). Hence, for those countries our measure of the stance of monetary policy contains significant information, which can be used to forecast expected stock returns. Particularly, we find that restrictive (expansive) monetary policy stance decreases (increases) expected stock returns.”
Do we agree?
Partially. When we analyze the data using a similar methodology and with data updated through 2018, we indeed find a negative relationship between monetary policy environment and forward 1-month equity returns. For example, annualized nominal returns in the United States were 10.6% and 8.8% in expansionary and contractionary regimes, respectively. The gap is larger for real returns – 7.5% in expansionary environments and 3.9% in contractionary environments.
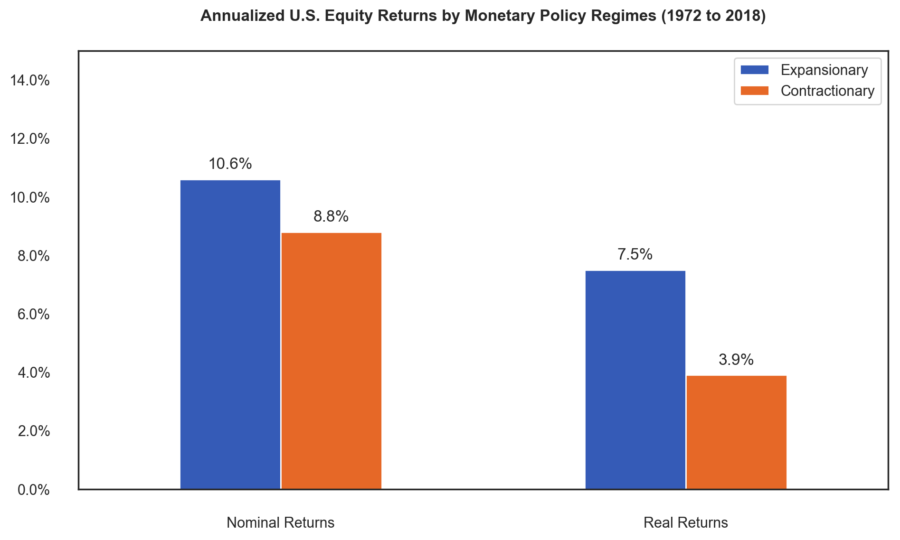
Source: Bloomberg, MSCI, Newfound Research. Past performance does not guarantee future results. Return data relies on hypothetical indices and is exclusive of all fees and expenses. Returns assume the reinvestment of dividends.
A similar, albeit more pronounced, pattern emerges when we go outside the United States and consider thirteen other countries.
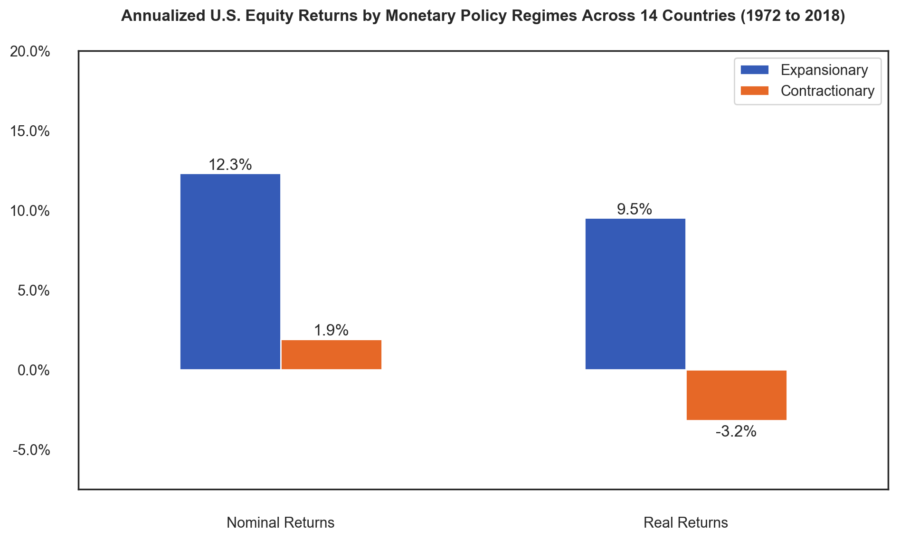
Source: Bloomberg, MSCI, Newfound Research. Past performance does not guarantee future results. Return data relies on hypothetical indices and is exclusive of all fees and expenses. Returns assume the reinvestment of dividends.