

By Rebecca Felton, Senior Market Strategist
SUMMARY
- We believe high inflation and rising interest rates have impacted spending trends, leaving earnings estimates vulnerable to downside revision.
- We believe the Fed will continue to raise rates throughout the remainder of 2022 even as the economy slows.
- Our strategies remain underweight equities.
Deteriorating Economic Conditions Could Lead to Earnings Disappointments this Quarter
Most of us are skeptical when we hear the phrase “this time is different,” but as we approach the earnings reporting period for the second quarter of 2022, we believe we may be facing one of those times. Throughout 2021, Wall Street grew accustomed to corporate earnings and revenues exceeding expectations. Quarterly reporting periods carried few blockbuster negative surprises, and earnings estimates steadily moved higher. The rapid decline in earnings in 2020, followed by the pronounced ‘V-shaped’ recovery starting in the spring of 2021, represented a rare, dramatic earnings recovery.
The speed with which corporate earnings returned to pre-pandemic levels was rapid enough that it may have created complacency that earnings growth would normalize to a mid-to-high single digit upward trend. To date, estimates for calendar 2022 are little changed since the beginning of the year. However, economically, plenty has changed since those original forecasts were made.
Consider the Following:
Everything costs more: Despite some optimistic forecasts that inflation may have peaked, this week’s release of the June Consumer Price Index (CPI) will likely continue to show inflation’s tenacity. Current consensus is for CPI to increase by 8.8% compared to last year’s rate. The optimism stems from the recent sell-off in commodities and gasoline prices trending lower. In contrast, food prices continue to move higher. In late June, the United States Department of Agriculture (USDA) raised its forecast for food inflation this year, projecting that supermarket prices will increase between 8.5%-9.5% this year. Goods such as poultry, eggs, and bakery are likely to see double-digit price increases.
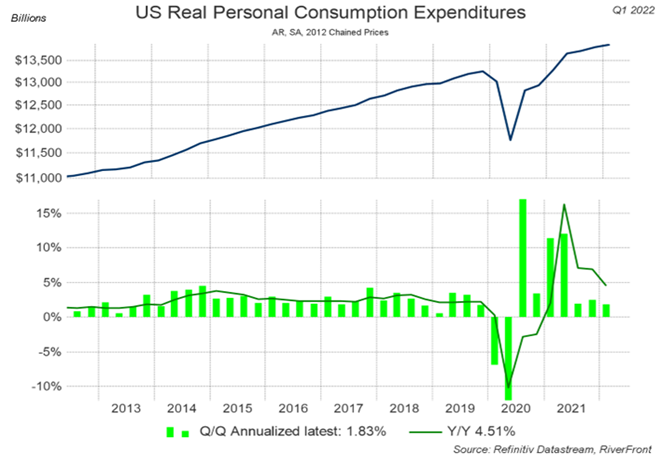
Source: Refinitive Datastream, RiverFront. Data as of Q1 2022. Chart used for illustrative purposes only.
Consumer sentiment has plunged, and spending habits are changing: One of the bright spots of the economic recovery has been the strength of the US consumer. Despite mixed readings in sentiment for much of the past year, the continued strength of retail sales supported the idea that consumers were still spending even if they were worried.
However, the most recent University of Michigan Index of Consumer Sentiment fell to a record low in June as elevated prices for food, gas, and other goods and services took a toll on how people feel about the economy. Last week’s release of ISM’s Services Purchasing Manager Index (PMI) data revealed that consumers are shifting purchases to essentials and away from discretionary items, in our opinion. Also, in the most recent first quarter Gross Domestic Product (GDP) revision, the Commerce Department revised consumer spending significantly lower from 3.1% to 1.8% (see chart, above).
Higher interest rates will dampen spending: Interest rates are headed meaningfully higher than what was expected at the beginning of the year. The initial expectations for two to three rate hikes fell by the wayside as the Federal Reserve (Fed) turned decidedly hawkish in response to rapidly rising inflation. The release of the minutes from the June meeting confirmed the possibility of a 50 or 75 basis point (bp) rate hike in July. The strength in recent employment data suggests to us inflationary wage pressure, making the 75bp hike in July more likely. Additionally, the minutes revealed that an even more restrictive stance would be appropriate if inflation remains elevated. Higher rates have a ripple effect through the economy and can act as headwinds for business and consumers alike as the cost of business loans, car loans, and mortgages impact spending plans.
Business enthusiasm has fallen dramatically: Corporate sentiment, as evidenced by both the Conference Board Measure of CEO Confidence and the National Federation of Independent Businesses Small Business Index, has sunk to record lows. The June report from the Conference Board painted a dim picture with over 60% of those surveyed saying that business conditions had worsened in the second quarter when compared to the first. Additionally, over 50% expect the economy to go into a short recession. The data compiled from the nation’s small business leaders echoed the grim outlook as the share of owners expecting better business conditions over the next six months hit a record low. Lowered levels of confidence about the future could alter plans for hiring and business expansion.
By the numbers: The Standard & Poor 500 (S&P 500) is now down more than 17% year-to-date, but earnings estimate for 2022 have not meaningfully deteriorated from levels projected at the beginning of the year, despite the economic headwinds and earnings warnings from some high-profile companies. Over the past three months, 102 companies in the S&P 500 have issued earnings guidance for the second quarter, with nearly 70% lowering expectations. We believe this is the quarter that could be different. Rather than growth exceeding expectations, we believe it is likely we will hear a more somber tone when management teams address investors.
In Conclusion
Stock market valuations have decreased significantly since the beginning of the year. However, when we think about Price to Earnings (P/E) ratios as a way to value stocks, it is important to remember that the “E” drives the “P.” A lower growth rate may already be factored into most expectations, but we believe the potential for further downside risk remains.
Earnings reports are not the only important headlines over the next several weeks. We will learn a lot about the state of the US economy with the release of retail sales, CPI, US GDP, and more. While these data points will serve to shape our views, RiverFront’s disciplined investment process will determine portfolio actions. Our strategies remain underweight equities because we believe it is a prudent course to navigate through periods of volatility and uncertainty.
Important Disclosure Information:
The comments above refer generally to financial markets and not RiverFront portfolios or any related performance. Opinions expressed are current as of the date shown and are subject to change. Past performance is not indicative of future results and diversification does not ensure a profit or protect against loss. All investments carry some level of risk, including loss of principal. An investment cannot be made directly in an index.
All charts shown for illustrative purposes only. Information or data shown or used in this material was received from sources believed to be reliable, but accuracy is not guaranteed.
This report does not provide recipients with information or advice that is sufficient on which to base an investment decision. This report does not take into account the specific investment objectives, financial situation or need of any particular client and may not be suitable for all types of investors. Recipients should consider the contents of this report as a single factor in making an investment decision. Additional fundamental and other analyses would be required to make an investment decision about any individual security identified in this report.
Standard & Poor’s (S&P) 500 Index TR USD (Large Cap) measures the performance of 500 large cap stocks, which together represent about 80% of the total US equities market.
The Consumer Price Index (CPI) is a measure that examines the weighted average of prices of a basket of consumer goods and services, such as transportation, food, and medical care. It is calculated by taking price changes for each item in the predetermined basket of goods and averaging them. Changes in the CPI are used to assess price changes associated with the cost of living. The CPI is one of the most frequently used statistics for identifying periods of inflation or deflation.
In a rising interest rate environment, the value of fixed-income securities generally declines.
When referring to being “overweight” or “underweight” relative to a market or asset class, RiverFront is referring to our current portfolios’ weightings compared to the composite benchmarks for each portfolio. Asset class weighting discussion refers to our Advantage portfolios. For more information on our other portfolios, please visit www.riverfrontig.com or contact your Financial Advisor.
Stocks represent partial ownership of a corporation. If the corporation does well, its value increases, and investors share in the appreciation. However, if it goes bankrupt, or performs poorly, investors can lose their entire initial investment (i.e., the stock price can go to zero).
Bonds represent a loan made by an investor to a corporation or government. As such, the investor gets a guaranteed interest rate for a specific period of time and expects to get their original investment back at the end of that time period, along with the interest earned. Investment risk is repayment of the principal (amount invested). In the event of a bankruptcy or other corporate disruption, bonds are senior to stocks. Investors should be aware of these differences prior to investing.
A basis point is a unit that is equal to 1/100th of 1%, and is used to denote the change in a financial instrument. The basis point is commonly used for calculating changes in interest rates, equity indexes and the yield of a fixed-income security. (bps = 1/100th of 1%)
P/E Ratio (TTM): The Price/Earnings Ratio or P/E Ratio is a valuation metric that assesses how many dollars investors are willing to pay for one dollar of a company’s earnings. It’s calculated by dividing a stock’s price by the company’s trailing 12-month earnings per share from continuous operations.
Gross domestic product (GDP) is the total monetary or market value of all the finished goods and services produced within a country’s borders in a specific time period. As a broad measure of overall domestic production, it functions as a comprehensive scorecard of a given country’s economic health.
The Conference Board (CB) is a not-for-profit research organization that distributes vital economic information to its peer-to-peer business members. The Composite Index of Leading Indicators, otherwise known as the Leading Economic Index (LEI), is an index published monthly by The Conference Board.
The National Federation of Independent Business (NFIB) Small Business Optimism Index is a composite of ten seasonally adjusted components. It provides a indication of the health of small businesses in the U.S., which account of roughly 50% of the nation’s private workforce.
The federal funds rate is the target interest rate set by the Federal Open Market Committee (FOMC). This is the rate at which commercial banks borrow and lend their excess reserves to each other overnight.
RiverFront Investment Group, LLC (“RiverFront”), is a registered investment adviser with the Securities and Exchange Commission. Registration as an investment adviser does not imply any level of skill or expertise. Any discussion of specific securities is provided for informational purposes only and should not be deemed as investment advice or a recommendation to buy or sell any individual security mentioned. RiverFront is affiliated with Robert W. Baird & Co. Incorporated (“Baird”), member FINRA/SIPC, from its minority ownership interest in RiverFront. RiverFront is owned primarily by its employees through RiverFront Investment Holding Group, LLC, the holding company for RiverFront. Baird Financial Corporation (BFC) is a minority owner of RiverFront Investment Holding Group, LLC and therefore an indirect owner of RiverFront. BFC is the parent company of Robert W. Baird & Co. Incorporated, a registered broker/dealer and investment adviser.
To review other risks and more information about RiverFront, please visit the website at www.riverfrontig.com and the Form ADV, Part 2A. Copyright ©2022 RiverFront Investment Group. All Rights Reserved. ID 2285541