

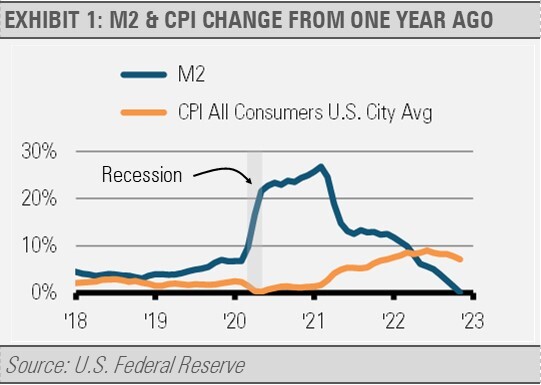
As the U.S. and global economies now deal with the aftereffects of massive fiscal and monetary overstimulation, the conversation shifts to the depth and length of the consequential recession. However, our focus remains on how we incorporate that information into investment strategies. As such, we have developed a few broad themes for 2023. One of our top themes is the surprising pace at which we expect headline inflation (CPI) to fall. The spike in CPI was primarily driven by the fast rise in broad money (M2) growth. The opposite side of the coin is also true as the collapse in the growth rate of M2 should be followed by a deceleration in the rate of headline CPI.
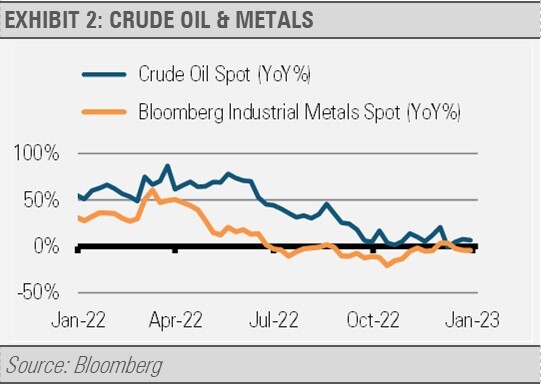
Additionally, oil prices have stabilized, and the prices of industrial metals have declined year-over-year despite their recent bounce. These trends are disinflationary and should help pull headline inflation down as well.
Finally, slowing economic growth reduces inflationary pressure overall. The Conference Board’s Leading Economic Index has declined for seven months, which suggests challenges ahead.
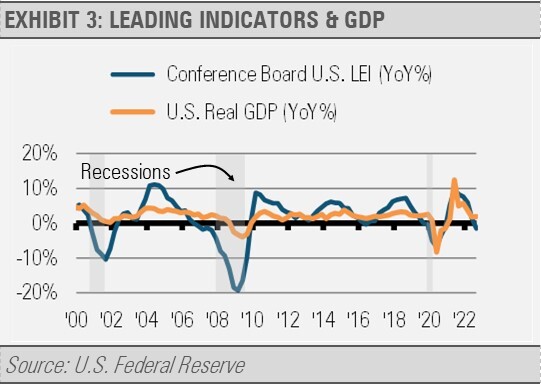
If U.S. economic growth declines to a snail’s pace, the pace of inflation should fall likewise. Additionally, should the U.S. enter a recession in 2023, the rate of inflation will decline that much faster, which may potentially bench the U.S. Federal Reserve as the economy finds its own equilibrium.
Looking beyond the near-term outlook and potential for near-term economic malaise, we expect the U.S. economy to begin a new long and high-quality business cycle. One of the key drivers underpinning our expected U.S. success on the other side of these near-term challenges is the relative strength of household balance sheets. In fact, U.S. household finances in aggregate are in far better shape compared to previous late business cycle environments, such as in 1990, 2001, and especially 2007.
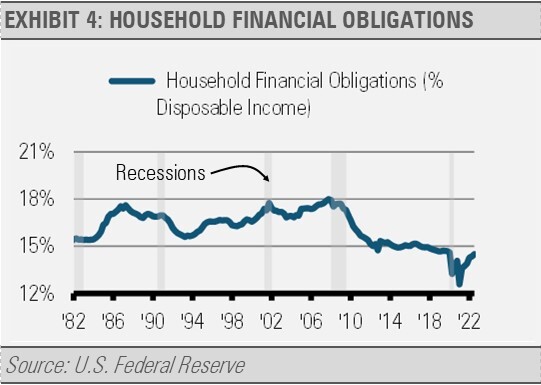
Importantly, many homeowners bought or refinanced during the recent period of historically low interest rates. As a result, homeowners have probably locked in low interest rates for decades to come.
Furthermore, as part of one of the world’s largest trading blocs by economic activity with Mexico and Canada, we think the U.S. is set to embark on a decade or more of stability based on an abundance of domestic resources with most geopolitical risk remaining oceans away.
INVESTMENT IMPLICATIONS
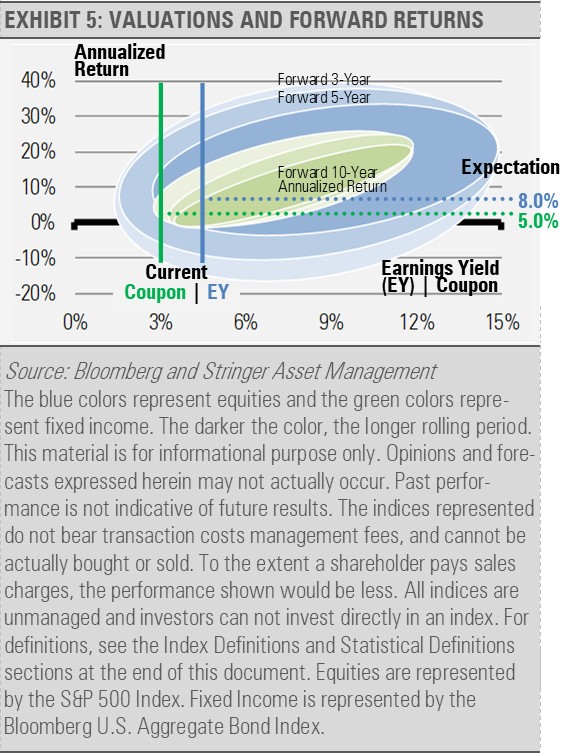
Our longer-term, strategic forecasts for equity and fixed income market returns are quite optimistic. Our work suggests that we should expect a roughly 8% annualized total return from equities based on the current earnings yield and dividend yield. Similarly, the current yield to worst of approximately 5% for investment grade core fixed income looks like a good expectation for average annualized total returns over the next several years.
We know from history that market timing does not work, so we remain invested with an emphasis on defense. Declining inflationary pressure should pull long-term interest rates down. In addition to the current attractive yields on high quality fixed income, we think that investors can look forward to experiencing some capital appreciation. In fact, we think that core investment grade bonds are the most attractive they have been since 2007, or about 15 years. To benefit from expected decline in interest rates, we have increased the interest rate sensitivity of our Strategies. We think that intermediate and longer duration Treasury ETFs can benefit in this environment.
With the economic challenges ahead, earnings consistency should be at a premium. Therefore, we are generally overweight sectors that should be more resilient to economic challenges, such as the healthcare and consumer staples sectors, as we navigate to and through what we believe will be a potentially shallow and short recessionary period.
We also know that the equity markets bottom before the economic turmoil is over and while the economic headlines are still extremely negative. While our Strategies are defensively positioned today, we are ready to redeploy assets in a more opportunistic way.
Our current economic and market environment may require endurance and discipline to navigate. We will continue to follow our Three Layers of Risk Management: Strategic, Tactical, and Cash Indicator as we forge ahead.
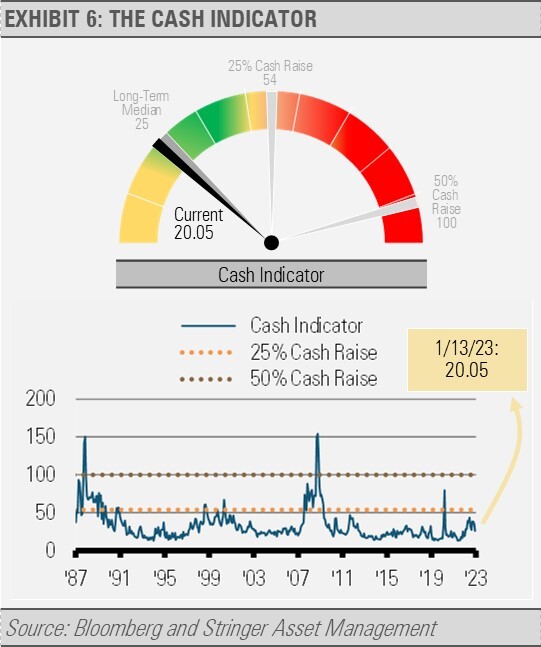
THE CASH INDICATOR
The Cash Indicator (CI) is near its historically normal levels. The CI can be an extremely valuable tool helping us to identify systematic market breakdown by measuring the relationship between fear in equity and fixed income markets. It can also inform our strategic and tactical work by serving as a warning light on our dashboard of tools even when the market appears to be running on all cylinders. While our fundamental work suggests volatility ahead, the CI indicates that the markets are functioning properly and there is little risk of an imminent collapse resulting from the systematic break down. As a result, significant equity market pullbacks are likely buying opportunities.
For more news, information, and analysis, visit the ETF Strategist Channel.
DISCLOSURES
Any forecasts, figures, opinions or investment techniques and strategies explained are Stringer Asset Management, LLC’s as of the date of publication. They are considered to be accurate at the time of writing, but no warranty of accuracy is given and no liability in respect to error or omission is accepted. They are subject to change without reference or notification. The views contained herein are not be taken as an advice or a recommendation to buy or sell any investment and the material should not be relied upon as containing sufficient information to support an investment decision. It should be noted that the value of investments and the income from them may fluctuate in accordance with market conditions and taxation agreements and investors may not get back the full amount invested.
Past performance and yield may not be a reliable guide to future performance. Current performance may be higher or lower than the performance quoted.
The securities identified and described may not represent all of the securities purchased, sold or recommended for client accounts. The reader should not assume that an investment in the securities identified was or will be profitable.
Data is provided by various sources and prepared by Stringer Asset Management, LLC and has not been verified or audited by an independent accountant.
Index Definitions:
S&P 500 Index – This Index is a capitalization-weighted index of 500 stocks. The Index is designed to measure performance of a broad domestic economy through changes in the aggregate market value of 500 stocks representing all major industries.
Bloomberg U.S. Aggregate Bond Index – This Index provides a measure of the U.S. investment grade bond market, which includes investment grade U.S. Government bonds, investment grade corporate bonds, mortgage pass-through securities and asset-backed securities that are publicly offered for sale in the United States. The securities in the Index must have at least 1 year remaining to maturity. In addition, the securities must be denominated in US dollars and must be fixed rate, nonconvertible and taxable.