Make no mistake about it: the S&P 500 is not a well-balanced portfolio. You hear it all the time, the S&P 500 is a passive index. In other words, there is no actively managed component to it. It does not diversify, reallocate, or rebalance, but that’s not to say that the S&P 500 is stagnant.
In reality, the S&P 500 is a momentum-based index. What does that mean? The S&P 500 is capitalization weighted. As securities pick up steam, or momentum, they become larger components of the index. The larger a stock is, the greater its impact.
The S&P 500 has looked very different over the course of the last few decades. Sure, it has always represented the 500 largest US publicly traded securities. It is important to note that the individual stocks and sectors are not equally weighted. When one sector of the market begins to outperform the others, then that sector will have a larger impact on the index’s performance. So, when the weightings get “out of balance” like they are right now, the index is not a good representation of the overall market.
Here are some current statistics on the S&P 500’s makeup:
- Out of 505 stocks, the largest 10 make up nearly 30% of the index.
- Out of the largest 10 stocks, 8 of them are technology-related (Johnson & Johnson and Berkshire Hathaway are the only 2 that are not)
- The S&P 500 is separated out into 11 sectors. The “Information Technology sector” (which does not include Communication services or Amazon/Tesla), is larger than Consumer Staples, Real Estate, Industrials, Materials, Utilities, and Energy combined
- Information technology, again not including Communications (stocks like Google and Facebook) or Amazon/Tesla, make up 27% of the index. The next largest sector is Healthcare at 13%. The second-largest sector is half the size of the largest market sector.
- If you just look at tech-related stocks, which would be information technology plus communications plus Amazon & Tesla, these stocks make up 44% of the market. That’s a total of 102 stocks (out of 505) accounting for nearly 50% of the index’s movement.
A Rebalancing Act
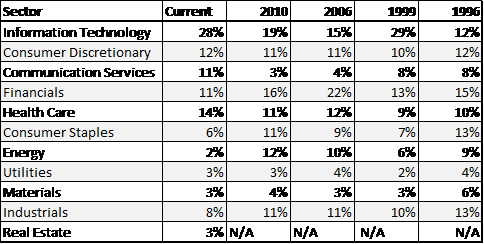
As mentioned before, the S&P 500 has not always looked the way it does today… but it has looked similar in the past. In other words, there has always been a sector that gets to be the largest component of the market, and oftentimes becomes significantly larger than the other sectors.
Looking at the chart above, you can see that in 1996, the S&P 500 sectors were well-balanced. The larger sectors were all in the neighborhood of about 10%. No sector stands out as the dominant. Just three short years later, that all changed. By 1999, the technology sector had taken off like a parabolic rocket and made up close to 30% of the index (almost 40% when you add in communications). What happened next? Well, the S&P 500 rebalanced itself by experiencing a bear market led by the largest sector. The Nasdaq, which measures mostly technology stocks, fell by -80%, rebalancing the sector back to 15% by 2006. In 2006, most sectors were fairly balanced, all with the exception of Financials. Financials made up the majority of the S&P 500 at 22%, probably topping out near 25% prior to the 2008 Financial Crisis, which rebalanced the S&P 500 by making the financial sector smaller. It also gave some increased weight to information technology.
In the 12 years since the bottom of the financial crisis, technology-related stocks have taken off and brought the markets with it. The dominance of Apple, Microsoft, Facebook, Google, Amazon, and Tesla has not been seen since the early 2000s. The point, however, is that the market is yet again out of balance. It’s only a matter of time before the market corrects its sector allocations in the form of a bear market.
Bottom Line
When will the next bear market occur, the one that rebalances the markets and wipes away years of savings and growth? It’s difficult to make predictions concerning the timing of an inevitable future event, but there will be signs of volatility increasing and these larger market segments will begin to fail. Right now, some of the market characteristics are in place that typically precede a major correction, such as sector weights being out of balance.
An efficient investment portfolio will not substantially overweight any single sector of the market. To do such a thing is recipe for a future disaster, just like what happened to the S&P 500 in both 2000 and 2008. An efficient portfolio will hold positions in some of the strongest sectors of the market, as well as other strong alternative areas. Unlike the market indexes, an efficient portfolio will not over-allocate to just one area, like the S&P 500 is overconcentrated in technology. That would be like holding 15 total positions and having one or two of those positions being larger than the other ones combined.
There will be times when the market is led or carried by the largest components. We have seen some sharp rises from the largest market segments in the last few years. Parabolic rises all end the same way—with a bear market in that sector that ultimately rebalances the market’s weightings.