
By Denis Rezendes, Assistant Portfolio Manager and Dave Haviland, Portfolio Manager and Managing Partner, Beaumont Capital Management
At BCM, we believe mitigating large drawdowns can be a crucial component of long-term investment success for investors. As such, we offer investment strategies that seek to provide growth with defensive capabilities. In our attempt to deliver on the latter goal, we’ve spent an inordinate amount of time trying to understand when large drawdowns are more likely to occur. It’s along these lines that the below chart by Jurrien Timmer, Director of Global Macro at Fidelity Investments, stood out to us.
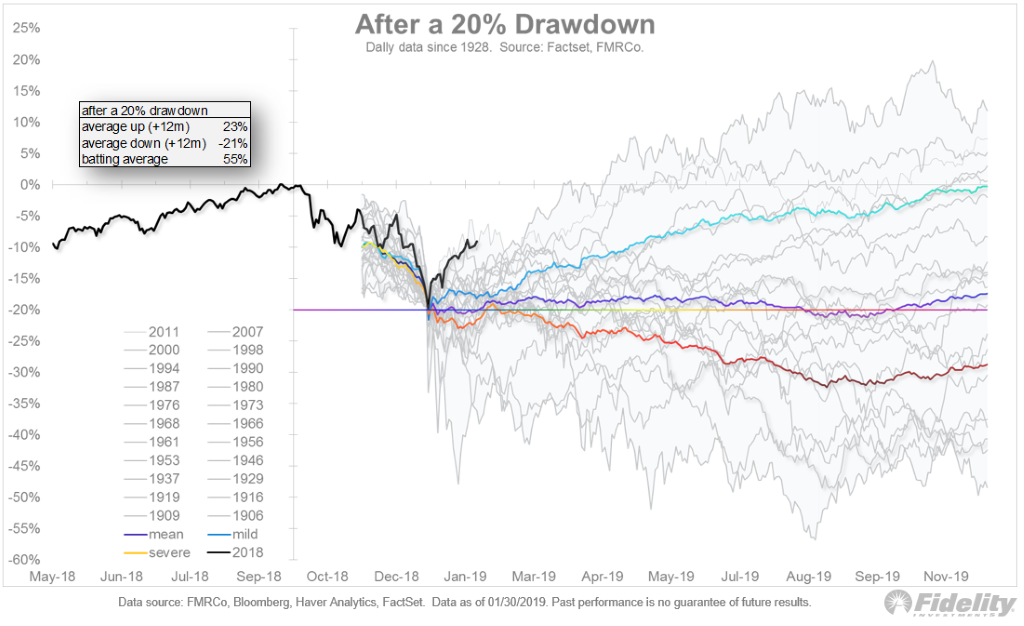
S&P 500® Index Twice as Likely to Fall After 20% Drawdown According to History
This chart complements our short December piece, Anatomy of a Bear Market, which outlines the length, strength and characteristics of all Bear Markets since WWII (ex-1987). It adds important context surrounding the current drawdown, versus all other 20% drawdowns since 1906, but it caught our eye for another more specific reason. In the box in the upper left-hand corner there’s a statistic called “batting average”. What this statistic tells us is that 55% percent of the time, the S&P 500® Index has realized a positive return in the year following a 20% drawdown, or—to invert it—45% of the time, the index realized a negative return in the year following a 20% drawdown. Additionally, the average return during these negative occurrences was -21% (in addition to the 20% already lost)!
To provide some context to these numbers, we studied the S&P 500 over a similar time period as the chart when daily data was available, from 1/3/1929 to 1/30/2019. Regardless of the type of market, we found that roughly 25% of the S&P 500’s 1-year returns were negative and that when the index realized a negative return it fell, on average, 14.8%. Although it may seem counterintuitive, after already having experienced a 20% drawdown, the S&P 500 was almost twice as likely to fall over the next year and when it did fall, the average return was nearly 7% worse.
Avoiding Large Drawdowns
This is obviously a simplistic analysis, but it’s a good illustration of what we’re trying to accomplish. Although we won’t be right on every occasion, we believe it is possible to identify the times when the probability that we’ll sustain a large loss is higher. It is our belief that if we reduce or eliminate market exposure during these times it will provide a satisfactory result over a full market cycle (including a bull and a bear market). To use an analogy, if a coin flip determined the success of your investments over the next year, would you accept those odds?
This article was contributed by Denis Rezendes and Dave Haviland, Portfolio Manager at Beaumont Capital Management, a participant in the ETF Strategist Channel.
For more insights like these, visit BCM’s blog at blog.investbcm.com
Disclosures: