

By Chris Konstantinos, CFA, Director of Investments, Chief Investment Strategist
SUMMARY
- Fed’s strong stance against inflation was necessary to repair credibility, in our view.
- Summer stock rally in danger, but we are not ready to say it is over yet.
- Watching economic and technical trends closely…we believe neither is quite as bad as it seems.
Watching the Stock Market’s ‘Decision Box’ Closely
After a powerful summer rally in July and early August that brought the S&P 500 briefly into cyclical ‘bull market’ territory, stocks have hit hard times again. We believe the recent meltdown has been driven by the reaction to Federal Reserve (Fed) Chairman Jay Powell’s Jackson Hole speech on August 26. The speech itself was blunt and to the point, with no Q&A. Powell reiterated the need for continued rate hikes until the Fed is confident that inflation is under control… even if it has negative repercussions for the economy. Powell directly referenced the inflationary 1970s, stating that: “the historical record cautions strongly against prematurely loosening policy.” This strong stance against inflation was echoed by other central bankers in Jackson Hole, including the European Central Bank.
The Fed’s message itself wasn’t that surprising – see our previous Weekly View Pushing Uphill: Our Three Tactical Rules Currently Flashing Caution for more on our view of Fed’s policy. If anything, we applaud Powell for attempting to restore some of the Fed’s credibility lost by underestimating the inflation threat. The Fed Funds futures market wasn’t surprised either, as probabilities have remained split about 40/60 between a 50 and 75 basis point hike in the September meeting… similar to estimates before Powell’s speech.
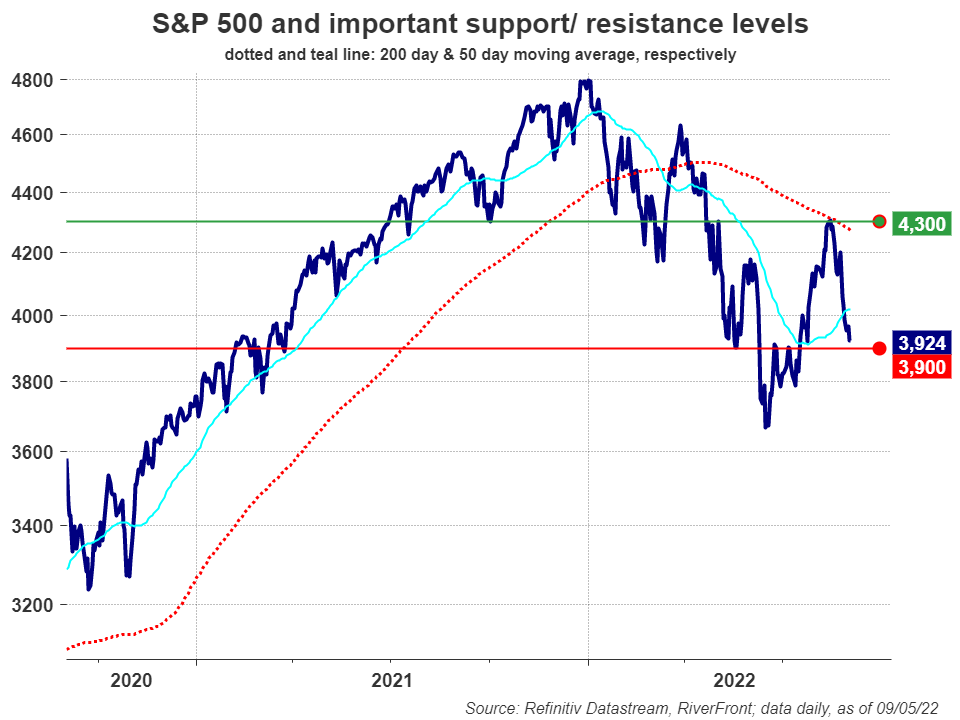 However, we believe the stock market’s reaction was one of shock, prompting the S&P 500 to sell off sharply that Friday and subsequently breaking through the psychologically important 4000 level. These types of sharp moves demand our attention, particularly at a time when the primary trend of the market is negative, as defined by a declining slope of the 200-day moving average – (dotted red line on chart, above). We think a prudent exercise in these times is to catalog the relevant fears in the market unemotionally, try to ascertain the facts on the ground as we see them, and set our game plan going forward.
The ‘Fears’: Fed Hiking Until ‘Something Breaks’?
We believe the stock market is worried that the Fed’s continued rate hikes and quantitative tightening (QT) of their balance sheet will drive the US economy into a protracted recession in the second half of 2022 or the early part of 2023. The correlated fear for the stock market is that it will make new lows in the second half of the year as this slowdown becomes more evident, and as corporate earnings start to collapse in response to the slowing economy.
These are concerns worth taking seriously, as history suggests, stock markets struggle with fast hiking cycles. According to NDR Research, in the past seven ‘fast’ Fed tightening cycles since WWII, on average the S&P bottomed 4 months after the first hike and was down an average of -2.7% after 12 months. If history is any guide, this suggests that we may have seen the bottom of the stock market, but that forward returns will remain muted throughout 2022 and the first part of next year.
History also suggests that bear markets followed by deep recessions – such as after the 2000 and 2007 peaks- tend to lose more value and are longer in duration than average cyclical bears. If the economy is indeed headed for a protracted recession, then stocks will likely breach the June 2022 lows. This situation is uncertain and highly fluid, requiring both humility and flexibility on the part of money managers. For our part, we remain vigilant in parsing both forward-looking economic and earnings data as well as the message of the market itself for clues into the likelihood of deep economic and earnings downturn.
The ‘Facts’: Economy and Earnings in a Pivotal Position…but Not All Bad News, in Our View
Despite the recent market selloff, we feel there are some interesting counterpoints to the current wall of gloom surrounding the stock market.
US economy and corporate sector mixed, but not uniformly ‘recessionary’:
- Some indicators suggest a US economy in recession; these include poor business confidence, a recent services PMI reading of well below 50, and anecdotal evidence of rising delinquency rates in areas such as electricity bills and credit card payments. However, other similarly broad economic indicators – such as the strong job payrolls number last week, low unemployment, and the recent strong print from the ISM core durable goods new orders survey – appear incompatible with a recession-like backdrop.
- Economic output itself is sending conflicting signals. While ‘real’ (inflation-adjusted) Gross Domestic Product (GDP) has now been negative for two quarters, real Gross Domestic Income (GDI) has remained positive. While their definitions differ slightly – GDI measures what participants in an economy ‘make’ in the form of wages and profits, whereas GDP counts the value of what the economy produces, such as goods and services – both are equally important to judging economic output and historically both rarely diverge.
- Furthermore, quarterly corporate profits and profit margins remain near record highs, according to recent data from the U.S. Bureau of Economic Analysis and the St. Louis Fed.
- Lastly, we would note that the economy in nominal terms continues to grow strongly, a point we’ve touched on in a Weekly View earlier in the summer “Recession: It’s Not The Name, It’s the Magnitude.”
 Inflation showing some signs of moderating:
- Important input costs such as gasoline, lumber, and industrial metals are well off recent highs. The GSCI Commodity Spot Price index is down roughly -20% since its peak on June 9, 2022.
- Various implied inflation rates, based on indicators in the bond and swaps markets, have also moderated to around 2.6-2.7% over the next five years, suggesting longer-term inflation fears are easing.
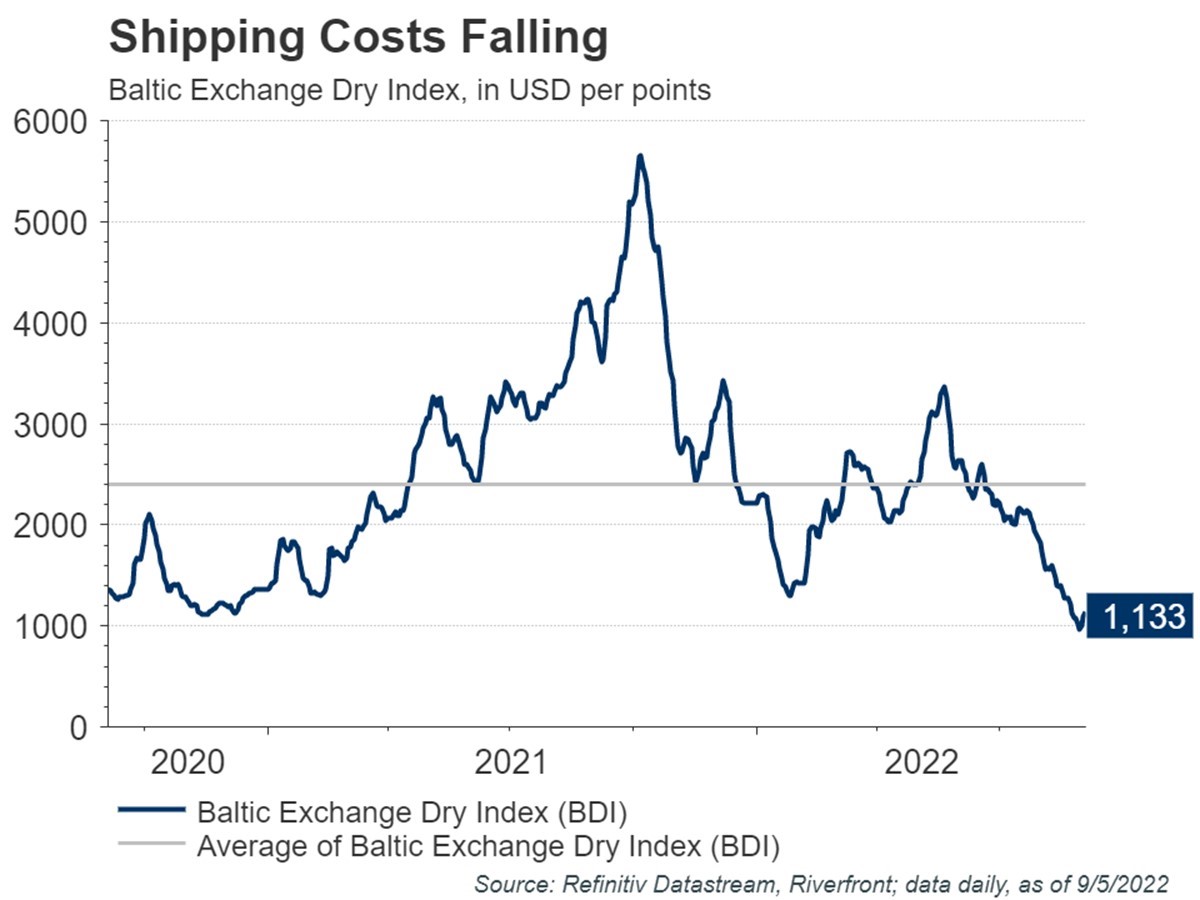
- Global shipping rates, as evidenced by the Baltic Dry Index, continue to drop below the average of the last two years, a dramatic improvement from 2021 highs (see chart, right).
The Message of Markets: Despite the selloff, the technical picture for the S&P 500 is not uniformly bad, in our view:
The summer’s technical strength up until a week and a half ago looked stronger than just a ‘bear market rally’ in our view. For instance, by mid-August, the market was able to retrace more than 50% of the entire sell off from the beginning of the year. This is a condition that has been historically consistent with an important low made in markets and represented an important milestone, in our opinion, for those tracking the ‘quality of the bounce.’ Other market internal technical measures we track, such as the Advance/Decline line and the Relative Strength Index (RSI), also concurrently improved significantly, and the market’s ability to break materially above the 4200-resistance level appeared decisive in our view.
Less than a month later, the picture is much cloudier. After the post-Fed conference selloff, we have broken through some near-term support and find ourselves now heading down close to the low end of a ‘decision box’ around important technical levels that we see between roughly 3900 and 4300. We see the next important support level at roughly 3900, around a two-thirds retracement of the rally from the June low. If 3900 breaks definitively to the downside, we would view the summer rally as being in danger and the likelihood of new lows in the market higher, though we see some further technical support around 3750. However, if the market can find its footing and manage to move up through the 200-day moving average at around 4300 (where we believe the most recent phase of the cyclical bull market failed), we would view that as an extremely encouraging sign that the ultimate market low has indeed been made.
The recent selloff also highlights the high levels of pessimism among market participants, as various measures of investor sentiment that we track have now flipped back into pessimism on both a shorter and longer-time horizon. We would also note that net positioning among hedge funds and other institutional players remain highly net short. From a contrarian perspective, too much pessimism in the market can be an indicator of a near-term bottom in markets; hence, one of our ‘Tactical Rules’ here at RiverFront is “Beware the Crowd at Extremes”. This suggests that on a technical breach, we may not look to meaningfully reduce risk while pessimism remains extreme.
CONCLUSION
Market fears of recession have taken over and may be with us for a while, despite conflicting signals from the US economy. The summer rally is in a precarious place, but we aren’t ready to call it exhausted just yet. Nonetheless, this is the type of highly uncertain environment that calls for humility and the willingness to change views when the facts change.
Important Disclosure Information:
The comments above refer generally to financial markets and not RiverFront portfolios or any related performance. Opinions expressed are current as of the date shown and are subject to change. Past performance is not indicative of future results and diversification does not ensure a profit or protect against loss. All investments carry some level of risk, including loss of principal. An investment cannot be made directly in an index.
Chartered Financial Analyst is a professional designation given by the CFA Institute (formerly AIMR) that measures the competence and integrity of financial analysts. Candidates are required to pass three levels of exams covering areas such as accounting, economics, ethics, money management and security analysis. Four years of investment/financial career experience are required before one can become a CFA charterholder. Enrollees in the program must hold a bachelor’s degree.
All charts shown for illustrative purposes only. Information or data shown or used in this material was received from sources believed to be reliable, but accuracy is not guaranteed.
This report does not provide recipients with information or advice that is sufficient on which to base an investment decision. This report does not take into account the specific investment objectives, financial situation or need of any particular client and may not be suitable for all types of investors. Recipients should consider the contents of this report as a single factor in making an investment decision. Additional fundamental and other analyses would be required to make an investment decision about any individual security identified in this report.
Standard & Poor’s (S&P) 500 Index measures the performance of 500 large cap stocks, which together represent about 80% of the total US equities market.
Gross domestic product (GDP) is the total monetary or market value of all the finished goods and services produced within a country’s borders in a specific time period. As a broad measure of overall domestic production, it functions as a comprehensive scorecard of a given country’s economic health
Gross domestic income (GDI) is a measure of a nation’s economic activity that is based on all of the money earned for all of the goods and services produced in the nation during a specific period.
Technical analysis is based on the study of historical price movements and past trend patterns. There are no assurances that movements or trends can or will be duplicated in the future.
The relative strength index (RSI) is a momentum indicator used in technical analysis.
The advance/decline line (or A/D line) is a technical indicator that plots the difference between the number of advancing and declining stocks on a daily basis.
In a rising interest rate environment, the value of fixed-income securities generally declines.
Quantitative tightening (QT) refers to monetary policies that contract, or reduce, the Federal Reserve System (Fed) balance sheet.
Stocks represent partial ownership of a corporation. If the corporation does well, its value increases, and investors share in the appreciation. However, if it goes bankrupt, or performs poorly, investors can lose their entire initial investment (i.e., the stock price can go to zero). Bonds represent a loan made by an investor to a corporation or government. As such, the investor gets a guaranteed interest rate for a specific period of time and expects to get their original investment back at the end of that time period, along with the interest earned. Investment risk is repayment of the principal (amount invested). In the event of a bankruptcy or other corporate disruption, bonds are senior to stocks. Investors should be aware of these differences prior to investing.
Don’t Fight the Fed – ‘Supportive’ means the Fed’s monetary policy regarding inflation and employment is in what we believe based on our analysis to be the investors’ best interest; ‘Against’ means the Fed’s monetary policy, in our view, is going against the investors’ best interest; ‘Neutral’ means the Fed’s monetary policy is neither supportive or against the investors’ best interest in our view. Don’t Fight the Trend – Terms correlate to the 200-day moving average as it relates to the equity indexes: ‘Positive’ means that the trend is rising, ‘Flat’ means the trend is flat, ‘Negative’ means the trend is falling. Beware the Crowd at Extremes – Terms correlate to the NDR Crowd Sentiment Poll and its measurement of Extreme Optimism (Bearish), Neutral, or Extreme Pessimism (Bullish).
RiverFront Investment Group, LLC (“RiverFront”), is a registered investment adviser with the Securities and Exchange Commission. Registration as an investment adviser does not imply any level of skill or expertise. Any discussion of specific securities is provided for informational purposes only and should not be deemed as investment advice or a recommendation to buy or sell any individual security mentioned. RiverFront is affiliated with Robert W. Baird & Co. Incorporated (“Baird”), member FINRA/SIPC, from its minority ownership interest in RiverFront. RiverFront is owned primarily by its employees through RiverFront Investment Holding Group, LLC, the holding company for RiverFront. Baird Financial Corporation (BFC) is a minority owner of RiverFront Investment Holding Group, LLC and therefore an indirect owner of RiverFront. BFC is the parent company of Robert W. Baird & Co. Incorporated, a registered broker/dealer and investment adviser.
To review other risks and more information about RiverFront, please visit the website at www.riverfrontig.com and the Form ADV, Part 2A. Copyright ©2022 RiverFront Investment Group. All Rights Reserved. ID 2411406