
This week we reflect on the subtle and not-so-subtle effects of the 10 year bull market. Read on to get our perspective on what makes an economy grow, an interesting thought from man who won capitalism, Ray Dalio and the usual ETF launches, TETF.Index performance and ETF Think Tank In the News.
Putting things into perspective
We are now officially in the midst of the longest growth rally in recent history. The historical first quarter erased almost all losses across most broad asset classes. In reality, not much has changed. We’ve observed and have written about, the global QE drawdown and stretched profit margins for US equities. From a recession watch, we highlighted the effects of a yield curve inversion as well as credits spreads’ usefulness as a signal for upcoming volatility.
What makes an economy grow?
Technological improvements, increased productivity, access to credit, and demographics; it has been quite some time since you’ve heard many focus on demographics. Over the last few decades, much of the growth in the developed world has been built on the backs of debt accumulation. There is sound economic theory to that, but as always when applied at scale, the micro details make the difference.
Much of the developed world has an aging problem. The combined EU fertility rate is approximately 1.59 babies per woman. Japan’s fertility rate is 1.4. China potentially engineered this issue for itself with its one child policy. Growth on debt accumulation is sustainable on a growing workforce, but the developed world’s workforce is shrinking (as a total percentage).
Recessionary periods tend to exacerbate this issue as less families feel financially stable enough to begin a family. You are seeing its effect on pension plans across the country. Social Security Administration has stated our economy needs a 2.8 ratio of workers paying into the system for every retiree collecting benefits, a ratio we are about to cross below.
Why all this talk about fertility rates and social security? Because this all ties back to Quantitative Easing. Quantitative Easing gave those with the strongest balance sheet access to below market rate capital at the country level, corporate level, and individual persons level. This isn’t to say QE is ever going away, looking at Japan as example leads us to believe this will be in play for the foreseeable future.
Who’s this Ray Dalio guy?
He’s the founder of quite arguably the most successful hedge fund in history, Bridgewater Associates. Ray Dalio reportedly took home $2,000,000,000 in 2018, and then proceeded to tell the world that the system is flat out broken, and the possibility of a class war is actually in the realm of possibilities. Think about that. The man that pretty much won capitalism, ranting the system is broken.
Why does this matter?
This matters because of what QE is, and frankly what currencies represent. Currency is paper backed by the faith of its government. Quantitative Easing is basically the second derivative of that. Different, but just as dependent on the trust of the system. Fewer and fewer people believe in its ability to spur actual economic growth. It’s quite possibly fueled the desire of those seeking alternative forms of currency (crypto-curries) as people chose to believe in the faith of the network over the elected.
The point – the Fed put
The Federal Reserve put is the golden child of US markets. It’s the get out of jail free, buy the dip backbone of the market. Where we stand today, there is little room for interest rate increases, and less and less confident in QE’s effects. We’re also seeing politics creep into the Federal Reserve more so than we feel comfortable with. What if the Fed Put doesn’t work? Ultimately, it’s more likely some new solution will eventually be pushed as the next great thing, and as long as enough believe it, it can work for a significant period of time as evidenced by this last decade of Quantitative Easing.
We just experienced the longest bull market in recent history, it’s time to put things into perspective and assess your risk.
The psychological effect of experiencing 10 years of near market bliss
2009
“just don’t lose me money”
2019
“beat the S&P 500 ever year, and maybe the NASDAQ 100 and DJIA while you’re at it”
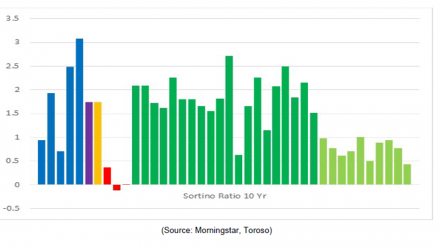
The worst “broad” asset class in US equities returned 12.66%, and the highest standard deviation was 18.5% (with the exclusion of energy).
Pretty much any way you slice it, US equities were king over the last decade. Regardless of sector, market cap, style box, factor focus (a universe of 19 that have 10 years of data); US equities outperformed ALL broad fixed income and international equity (with the exception of XLE – energy).
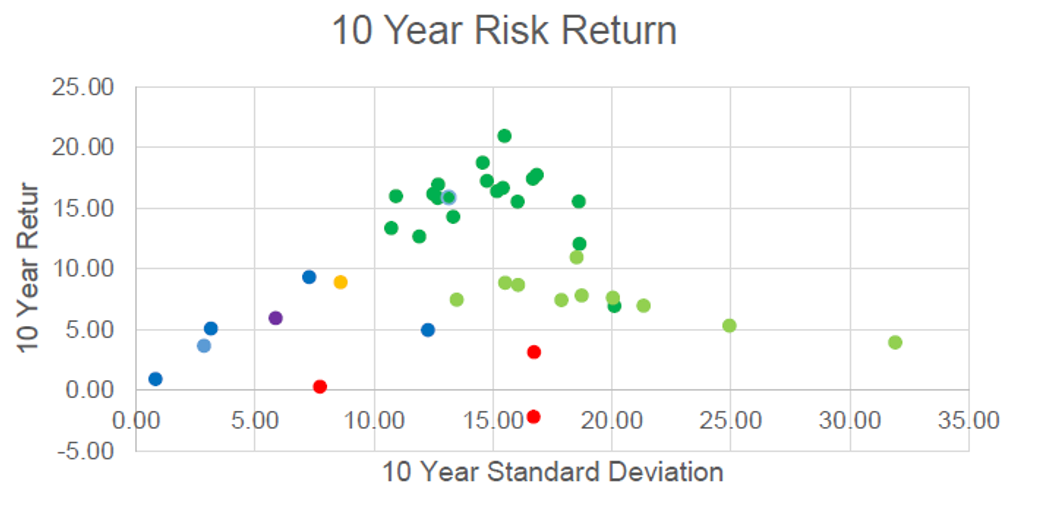

Dark Green:
Broad US Equity ETFs
Market cap, sector, dividend, equal weight
Light Green:
International Equity ETFS
Broad markets, regions, and large intl countries such as China, Japan, UK etc.
Blue:
Fixed Income
Short term treasury, long term treasury, corporates, high yield
Red:
Alternative ETFs
Commodities, Gold, Strong Dollar
Purple:
All weather
Yellow:
60 ACWI 40 AGG
The 3 notable spikes in blue, soaring past parts of the US equity market come from fixed income. The Sortino Ratios (in blue) from highest to lowest are, the iShares Intermediate Term Corporate Bond (ICIB), iShares High Yield (HYG), and iShares AGG (AGG). Be wary of your US focused 60/40 portfolio, it has quite possibly never had a better run than this (relative). Read More HERE
This article was contributed by the team at Toroso Investments, creators of the ETF Think Tank and a participant in the ETF Strategist Channel.
Click here to see disclosures.