Underlying Economic Strength Likely to Prevail Over Recent Equity Market Weakness
By J. Richard Fredericks, Main Management
The Christmas Holiday shopping season kicked off last week starting with Black Friday (November 23) which is traditionally the busiest shopping day of the year. More than 160 million people are expected to shop over the five-day weekend (which includes Cyber Monday). The Christmas Holiday shopping season is incredibly important as 25%-30% of annual retail sales will take place over the next six weeks and the profitability of many retail companies depends entirely upon the success of this brief period.
One of the best sources of data on the consumer and what they intend to spend in this period is the National Retail Federation (NRF). They provide a forecast each year and update it frequently. Their total sales estimates exclude automobile sales, gasoline, and food services. Other prognosticators often include some or part of those factors, so it is the mix and the percentage change that matters when comparing forecasts. As you can see from the chart below the NRF expects holiday sales gains of 4.5-4.8% versus an average of 3.9% over the past five years.
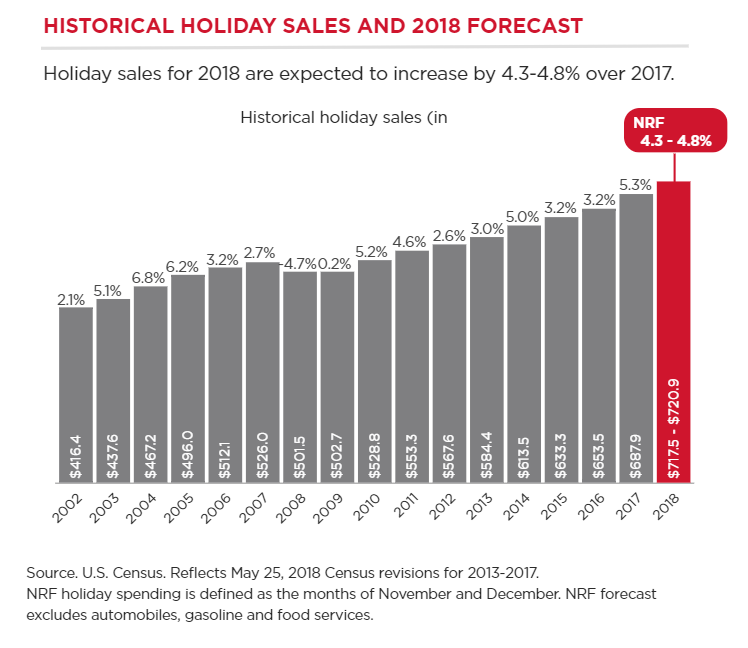
As the table above indicates the current projection by the NRF is smaller than the 5.3% gain posted a year ago, which in turn was the largest percentage change since 2010. For reasons we develop in this article, we believe that even though the economy is coming off a bit from its recent torrid pace, the gains will exceed the estimates posted by the NRF and possibly be the best gains achieved since 2005.
There are many sources which predict varying gains for the season although comparisons between the prognosticators can be difficult because of the aforementioned different definitions, time spans, and/or mediums (online v. offline, or combined). For instance, Gallup predicts that “sales growth of up to 6%” could be possible. Adobe Digital Insights has said “Consumers will spend $124.1 billion online this holiday season in the US which accounts for nearly $1 of every $6 spent shopping overall during November-December period … That’s 14.8% YoY growth.” (Note: that estimated growth rate is online only and not indicative of overall sales which would include results from brick and mortar sales). Deloitte also weighs in and has estimated that retail sales (of all types) will be up 5.0-5.6% above the levels in 2017.
We believe that depending on whichever prognosticator that one might follow, their estimates will be achieved … and then some. Why are we so positive that they will meet or beat their numbers? It is because the economy is in such great shape at this point in time and while we expect GDP to be slower in 2019 than 2018, there still is enough momentum to make this a notable Christmas selling season. Some of our rationale follows:
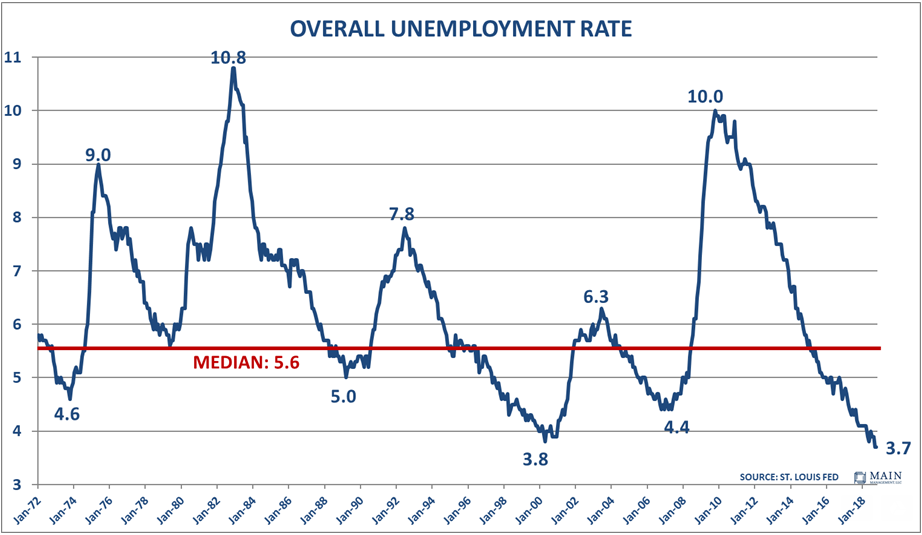
- The employment situation is in phenomenal shape. The unemployment rate is extraordinarily low at only 3.7%. That achievement is bolstered by a broadening of the employment base as (a) Black employment levels are at all-time lows; (b) Hispanic employment levels are at all-time lows; (c) Unemployment levels amongst women are at lows not seen since October of 1953; and (d) Handicapped unemployment is at the lowest levels ever recorded. Another way to think about just how low the level of unemployment is today reflected by the fact that only 2.3% of the time since January 1954 has the unemployment levels been lower (18 out of 778 months).
- Since the beginning of 2018, there have been 2.125 million jobs added to the workforce. That represents 2.125 million more people who could be included in the number of shoppers who may have only made minimum purchases, or even none at all last year. With a new job, they may feel more expansive this Christmas season. We are also encouraged by the fact that 60% of the job gains since the election have been among minority groups.
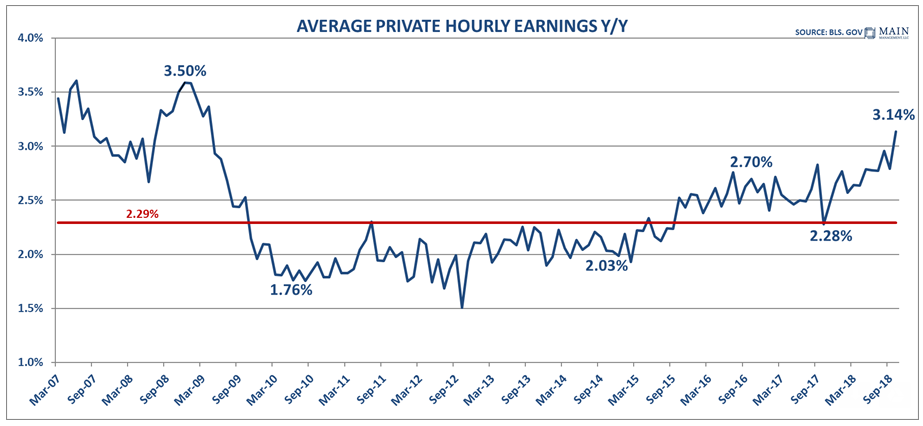
- Not only are the job totals at record highs in numbers and as a percentage of the population, wages have started to move more positively as well. The most recently reported average hourly earnings figure released by the Bureau of Labor Statistics was a 3.1% increase, which is the highest recorded in 10 years. Also encouraging is the fact that non-supervisory personnel experienced even a higher advance of 3.2% which indicates that lower level employees are sharing equally in the increases.
- Disposable income, whether measured in real or nominal terms continues to march higher. With inflation hovering only around 2% and wage gains of 3% plus, workers are putting more money into their pockets (Note: the latest 3-month average year over year growth in real disposable income was very healthy at 2.9%). Further, the tax cuts have enhanced the totals and that will be especially noticeable when individuals file their returns in early 2019.
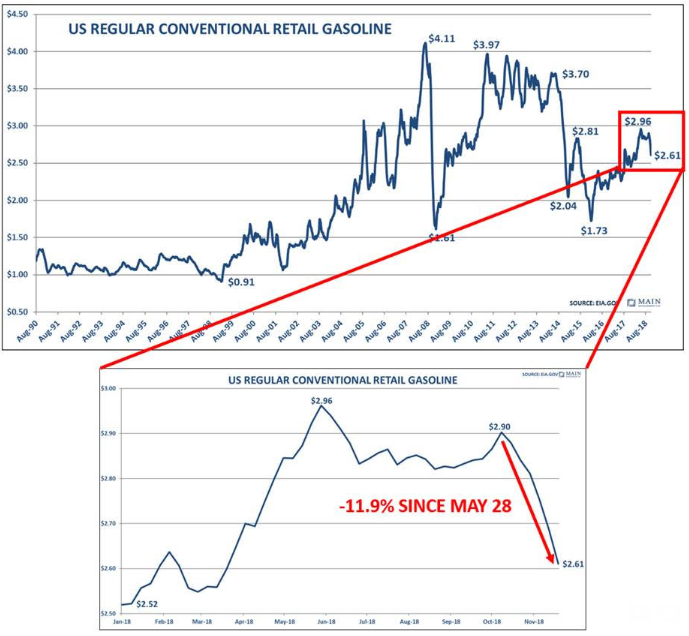
- Adding to the trends in disposable income is the recent decline in gas prices which have fallen approximately $0.30 over the past six weeks. That is like receiving a mini-tax cut for consumers and it is especially impactful for the lowest income earners.
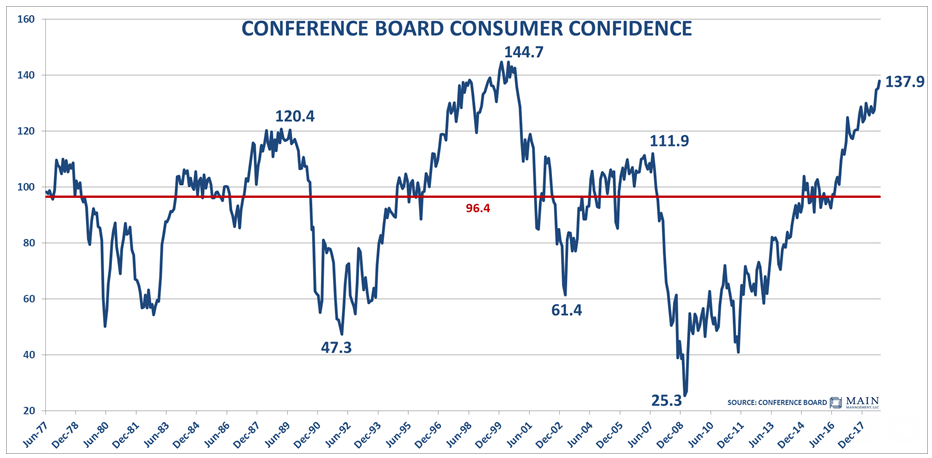
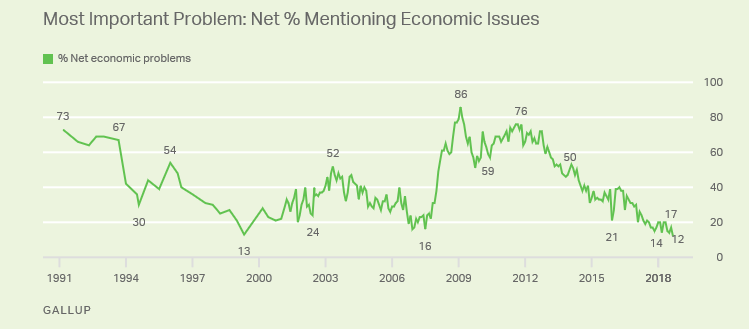
- The level of ‘optimism’ going into this Christmas selling season is very robust. Whether one looks at the Michigan Consumer Survey or the Conference Board Consumer Confidence Survey, they show the same picture – they are at levels that indicate confidence/optimism about the economy. The first panel below shows the Conference Board Consumer Confidence chart which indicates near record levels, while the second addresses the nation’s economic concerns. The latter indicates there is very little concern about economic problems in our country. Currently, according to Gallup, 54% of Americans rate economic conditions as “excellent” or “good,” and only 12% as “poor” which may be one of the lowest numbers recorded. Also, by 57% to 34%, more Americans say the economy is getting better than say it is getting worse. According to Gallup, it is the best reading of Americans’ evaluation of the economy since November of 2000.
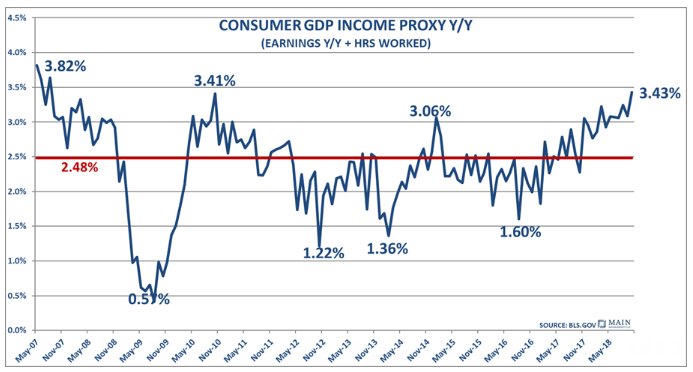
- One summary measurement that captures all the above data can be found in our Consumer GDP Income Proxy. We define this measure as consumer earnings plus hours worked, on a year over year basis. The current growth rate of 3.43% is the best number recorded since late 2007 and is a clear representation of the current strength of the consumer.
A couple of other measures
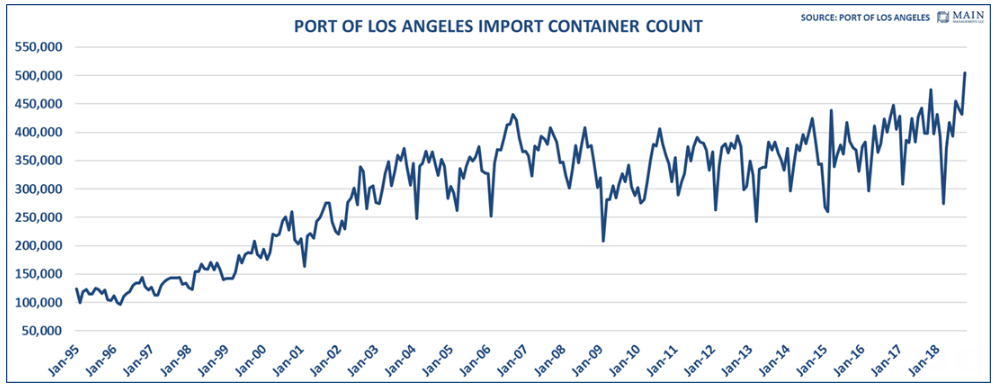
The two panels below shed some light on the economy that aren’t necessarily a direct consumer measure of strength. The first chart shows the container count for imports coming into the Port of Los Angeles, which is the largest in the country. We look at imports because they are an indication of good brought in for retailer’s inventory and you can observe a pattern where the numbers keep grinding higher. The Port of Los Angeles numbers are further confirmed by the figures just reported by Port of Long Beach, which is the second largest port in the country. The Port of Long Beach just closed out their October fiscal year with an annual gain of 7.4% in inbound container units handed and a record amount of containers handled for the month of October. No doubt some of the recent strength reflects some pre-ordering to manage inventory given the tariff situation between the US and China, but we also believe it reflects the desire of retailers to have inventory on hand because they anticipate a robust holiday sales outcome.
The second panel is one of former Fed Chair Alan Greenspan’s favorite indicators – corrugated boxes. With all the shipping done by Amazon, Fedex, and UPS, it is an indicator that shows the movement of goods across the country.