By Canterbury Investment Management
Market State 2- Bullish: The S&P 500 remains in Market State 2 despite last week’s rollercoaster. Overall, the market was relatively flat last week, only falling around -0.30%. Last week did however, end with -1.23%, -1.79%, +0.80%, and +1.42% days. That is 3 days beyond +/-1.00% that resulted in a flat week.
We mentioned in last week’s update that although we are currently in Market State 2, “a pullback could be more likely to happen as the market approaches overhead resistance levels.” Since that time, the market did pullback, falling a little more than -5% from September 12th’s relative peak to the low point on October 3rd.
Canterbury weekly update video: https://www.youtube.com/watch?v=5OxzED2ozGQ
Canterbury Volatility Index (CVI)- CVI 74: For the last few weekly updates, we have discussed the possibility of seeing some outlier days. Below are some excerpts from the last two updates that help explain last week’s outliers:
September 23rd Update:
Short-term volatility has declined to CVI 38. This puts short-term volatility at an extreme low level, and at a disparity compared to longer-term volatility. From Canterbury’s studies, there have been 60 occurrences since 1950 when short-term volatility has been at an extreme low, and long-term volatility has been at least 30 points higher. Of these 60 periods, all them ended with an average of +/-1.00% day, with 31 of the periods ending with a -1.00% day and 29 of the periods ending in a +1.00%. Extreme low volatility, like the volatility shown in the short-term CVI, is similar to the squeezing down of a spring—you may expect to see a “pop”.
September 30th Update:
Short-term volatility (a 10-day CVI) remains at an extreme low (CVI 40). At extreme lows, outliers are more likely to occur. In the case of outliers and extreme low volatility, there is no way to tell when the outlier will happen, whether it will be up or down, or the extent of the outlier, only that outliers are more probable in this environment.
While last week’s outliers only caused the Canterbury Volatility Index to rise from CVI 69 to CVI 74, the outliers were enough to take short-term volatility out of extreme-low territory. The short-term Canterbury Volatility Index, which is much faster moving, rose from CVI 40 to CVI 84, releasing some of the pent-up pressure we have been talking about.
Comment
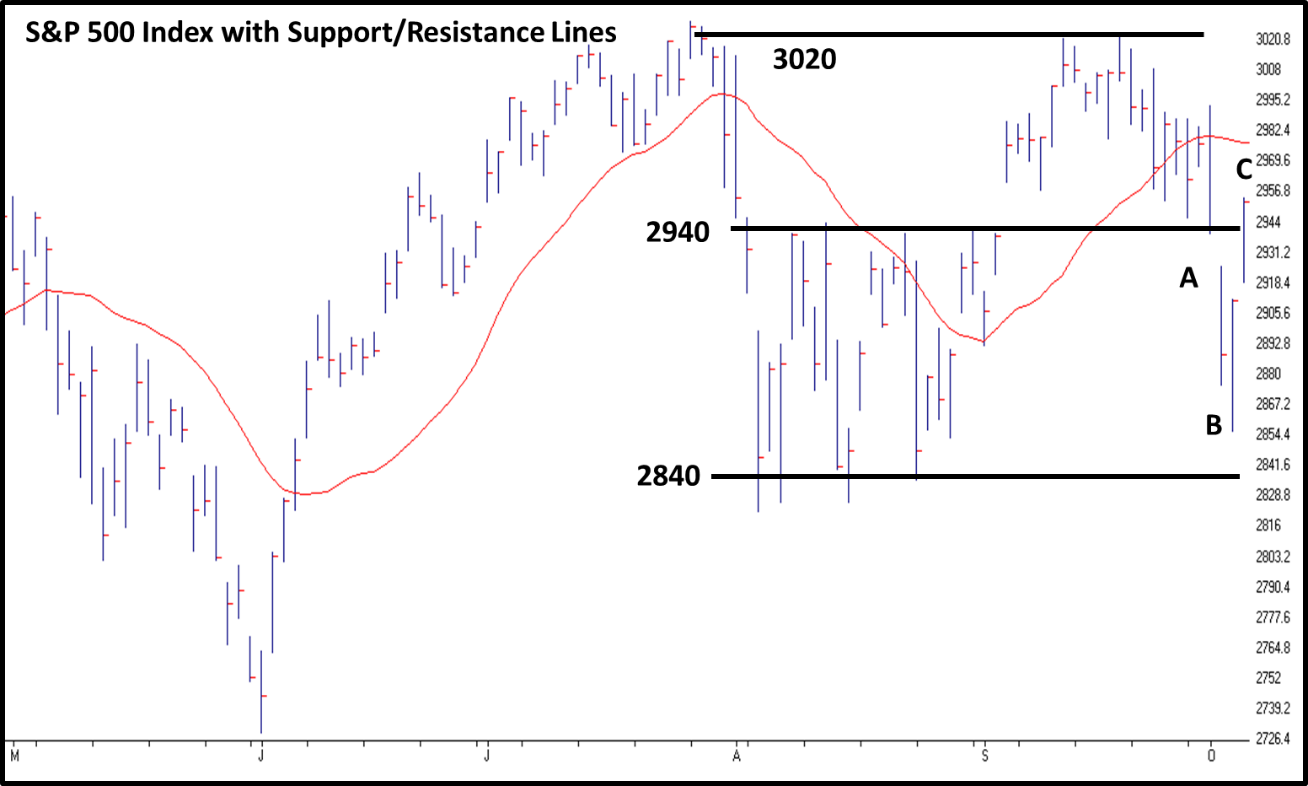
We have been discussing the concept of support and resistance lately. As a reminder, support and resistance are where supply and demand shift. At support points, demand takes control and causes a rally. At resistance, supply takes control and causes the market to fall. We saw a perfect example of this last week.
In last week’s update, there was a note that one of two things were about to happen: “a break of support, or a rally back to resistance.” The former of two occurred. On Wednesday, the S&P 500 broke its lower support level and fell -1.79%. The most likely move from here, would to go test the next support level at around 2840. Thursday, October 3rd was an interesting day. The market started off with a continued downward movement towards that 2840 support level, falling more than -1.00%, but ended the day with a rally to actually finish up 0.80% for the day. The subsequent day, Friday, saw a rally back slightly above the old support level at about 2940, which is now going may behave like resistance.
The chart below just highlights some of the points made above. The highest resistance level is at above 3020 (resistance/support lines should be drawn with a thick pen). The market hits this level, but then falls to support at about 2940. At Point A, support is broken. At Point B, the market falls lower towards the lowest support level on the chart at 2840 but rallies intraday to finish on its high. At Point C, the S&P 500 rallies all the way back to the old support at 2940.

We will make a similar statement to last week: from this point, one of two things can happen. Either the market will bounce off the 2940 level, establishing it as clear resistance, or it will break through it and rally upward.
Portfolio Thermostat
The Canterbury Portfolio Thermostat does not aim to compete against any individual index or blended benchmark. We know that portfolio efficiency is a moving target, and all asset classes will go in and out of favor. The Portfolio Thermostat is an Adaptive Portfolio Strategy designed to navigate various markets and create an efficient portfolio for today’s environment- Bull or Bear.
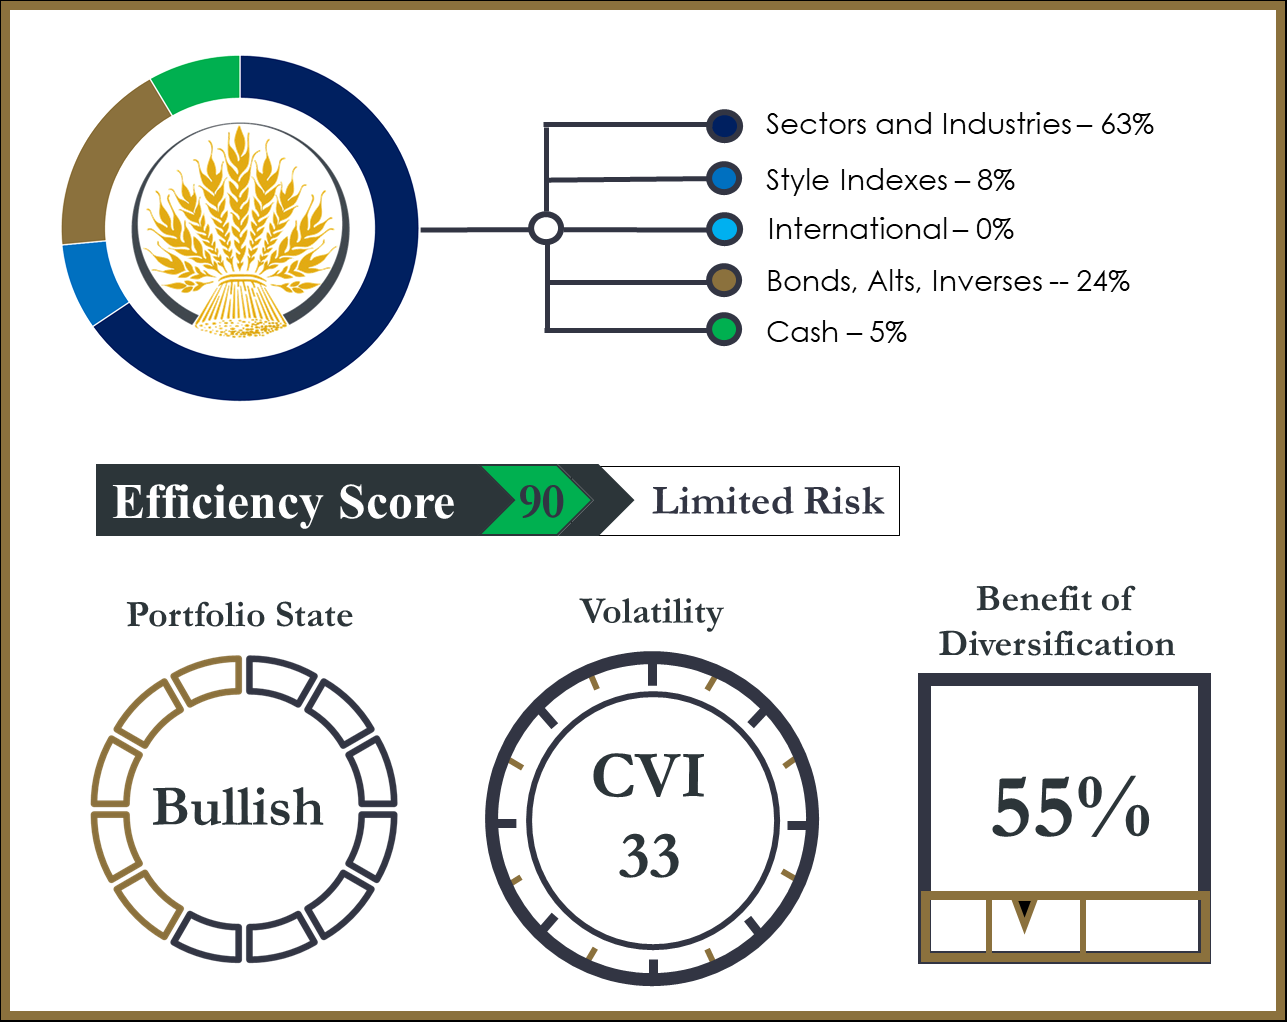
Canterbury benchmarks its portfolio against key “internal” metrics, in order to measure portfolio efficiency. These metrics are Portfolio State, Portfolio Volatility, and Portfolio Benefit of Diversification. Together, these internal benchmarks create the Portfolio Efficiency Score.

The Portfolio Thermostat maintained stability last week, amidst the market’s erratic movements. This was primarily due to the Thermostat’s high Benefit of Diversification. The Benefit of Diversification is proprietary metric in computing a Portfolio Efficiency Score. In a market environment that has low and stable volatility, according to the Canterbury Volatility Index, we want to see a lower Benefit of Diversification (between 25-35%). However, in a market environment where we are seeing more outlier days than normal, we want our portfolio’s Benefit of Diversification to be higher- like it is today at 55%.
Every position held within an Adaptive Portfolio Strategy, like the Canterbury Portfolio Thermostat, holds a specific purpose. For example, the Portfolio Thermostat currently holds several equity positions ranging from industries to sectors to style indexes. These positions are highly ranked in terms of volatility-weighted-relative-strength. The Thermostat also holds a few inverse positions. The purpose of these holdings is to help stabilize the portfolio when markets become volatile. The combination of these different securities create an efficient portfolio with low volatility and a high degree of diversification.
Bottom Line
Short-term volatility spiked last week and resulted in 3 days beyond +/-1.00%. This occurred right as the market hit a point of support. After breaking the support level, the market has since rallied back to the same support line. This line will either act as resistance, and the S&P 500 will bounce off of it and head lower, or will break through it.
The Portfolio Thermostat has been perfectly positioned to handle this market environment. As the market has fluctuated in between support and resistance, the Portfolio Thermostat has maintained stability. The combination of securities held within the portfolio have created a high efficiency rating, as well as low volatility. As the market decides where it wants to go next, whether it continues to new highs, or turns Transitional, the Portfolio Thermostat will continue to adapt.
Watch the Canterbury Weekly Update 10.7.2019:
This article was submitted by Canterbury Investment Management, a participant in the ETF Strategist Channel.
https://www.canterburygroup.com/page.php?page=&pageid=7f19482fdcaf504838389174cd149e2d

