

Editor’s Note: The following information was originally published on October 15, 2018.
We see ongoing investment opportunities in the U.S., tied to its economic leadership. We also see new opportunities in Asia, where equity underperformance has shifted the region’s risk and return outlook. While markets always face uncertainties,economic and market fundamentals appear stable.
Q3 2018 Review
The U.S. has demonstrated its relative economic strength this year. The positive economic picture in the U.S. and a reset of growth expectations for overseas economies contributed to significant outperformance in the first three quarters of the year for U.S. equities compared to international markets.
Even with favorable data, U.S. economic readings still point to moderate growth. The 4.2% GDP growth in Q2, for example, was driven, in part, by an unusual boost from exports, as illustrated in Figure 1. U.S. GDP growth on a year-over-year basis, which helps smooth out quarter-to-quarter volatility, remains below 3%. Figure 1 also shows we have seen a number of quarters with annualized GDP growth in excess of 4%, even within the moderate growth trend of the current expansion.

Overseas, developed economies continue to deliver modest economic growth. The fundamentals in emerging markets, however, have been more mixed. For example, political and economic instability in countries like Turkey and in regions like Latin America contrast sharply with the relative stability in Asian emerging market countries.
Global equity market returns varied broadly across countries and regions in Q3, but regional equity market winners largely mirrored the fundamental backdrop, which is often not the case in the short run. For example, U.S. equities posted strong performance, with the S&P 500 returning 7.7%, its highest quarterly return in eight years. It is also not surprising to see stocks pull back in early Q4 on the heels of strong Q3 returns.
Within the U.S., equity sectors that are benefitting from secular trends generally outperformed, including Health Care and Information Technology. In contrast, sectors with the most economic and interest rate sensitivity generally lagged, including Energy, Materials, Real Estate and Utilities. Industrials were an outlier among economically-sensitive U.S. sectors in Q3, outperforming as investors’ concerns about trade tensions seemed to ease. Despite this bounce, Industrials continued to underperform year-to-date.
Outside the U.S., a deterioration in investor sentiment with respect to international equities, especially for emerging markets, led to their underperformance in Q3. Developed international markets posted modest gains overall, but signs of slowing growth in Europe, for instance, belied elevated investor expectations and weighed on returns. The MSCI Emerging Markets Index actually declined 1.1% in Q3, driven by a combination of continued concern over international trade tensions, signs of slower global growth, and U.S. dollar strength.
U.S. interest rates continued to rise in Q3, albeit at a slower pace than in the first half of the year. This presented a continued headwind for fixed-income returns in the quarter. Treasury bonds were particularly impacted due, in part, to their higher duration (interest rate sensitivity) relative to corporate bonds of similar maturity, and also due to shrinking credit spreads. Longer-term interest rates have moved up further in the first few weeks of Q4.
Outlook
U.S. Outlook: Our overall global economic outlook remains positive. The U.S. continues on a trend of moderate economic growth. The 4.2% annualized GDP growth for Q2 was a deviation from the multiple-year trend of 2% to 3% readings. However, other broad based measures of the U.S. economy, like the Chicago Fed National Activity Index (CFNAI), continue to point to moderate growth in Q2 and Q3, consistent with the 2.3% average annualized growth rate during the current expansion.
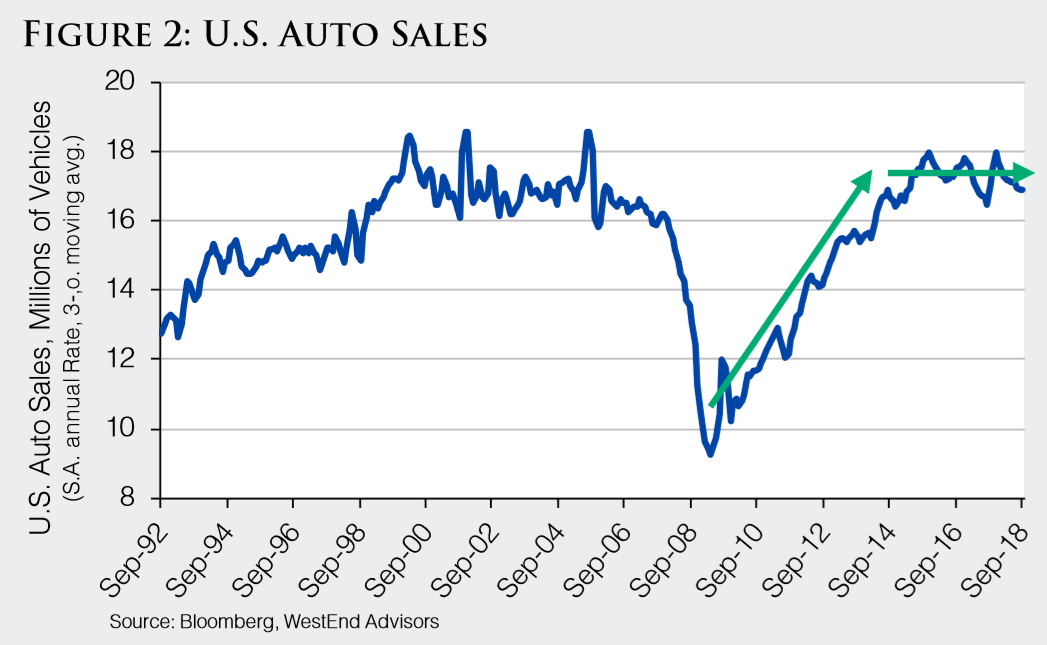
The U.S. economy has made significant progress since the cyclical trough in 2009, including a rebound in auto sales, growth in construction spending, and a tightening of the labor market. However, while auto sales (Figure 2) and construction spending remain at high levels, their growth has stalled, and unemployment has dipped well below levels economists have historically considered to represent “full employment.” This suggests there is limited economic fuel to drive sustained dynamic growth going forward. However, at this point, these constraints appear to be acting more as a governor on the economic throttle rather than an outright brake for the economy.
Data in Q3, meanwhile, reaffirmed our view that the consumer remains healthy and a key driver of the economy. Core retail sales growth has been trending higher, and hit 5.2% year-over-year as of August. The spending increases are supported by income growth, which is increasingly coming from gains in hourly wages, rather than additional hiring and hours worked. In fact, growth in average hourly wages reached 2.9% in August, the highest rate since mid-2009.
This shift among over sources of personal income is expected as the economic cycle matures. Personal income growth, which incorporates job growth as well as wage gains, was 4.7% year-over-year in August. This should support continued consumer spending
There remain risks to growth in the U.S., however, even as the consumer picture is positive. For example, the flip-side of wage growth is rising costs to employers, which, in addition to dampening profitability, could eventually translate into general inflationary pressure. This, in turn, could put additional upward pressure on interest rates. As shown in Figure 3, the U.S. Employment Cost Index, which accounts for wages and other forms of employee compensation, is nearing 3% growth on a year-over-year basis.