

By Doug Sandler, Chris Konstantinos & Rod Smyth, RiverFront Investment Group
Bull Market Still In Tact, In Our View
In the last few months we have cut back the equity weightings in our balanced accounts to neutral primarily through a significant reduction in developed international stocks, even though our strategic process suggests better long-term returns from international stocks. The reductions are part of our risk management process and have been driven by two main factors, the escalation of tariffs and the underperformance of non-US markets. For the reasons outlined below, we expect to re-invest in stocks, but we regard the risk of a further escalation of tariffs as sufficient to warrant caution at present. However, the following charts support our opinion that the structural bull market is still intact.
Market-Peak Watch: A Checklist
While market corrections are commonplace, the end of a secular bull market is a rare event. Structural, multi-year stock market peaks – the likes of which we witnessed in 2000 and 2007- are usually marked by one or more of a combination of the following conditions, in our opinion.
- THREAT OF IMMINENT RECESSION
- OVERLY RESTRICTIVE MONETARY POLICY
- EXCESSIVE VALUATION
- EXTERNAL SHOCK
![]()

No Recession in Sight: Economic Surveys and Earnings Revisions Remain Positive
Earnings momentum (blue line – the net number of positive analyst earnings-per-share estimate revisions, divided by the total number of estimates) for the S&P 500 index recently reached levels of positive momentum that we haven’t seen in over a decade.
We think this momentum is related to positive economic fundamentals – as demonstrated by the ISM manufacturing survey (dotted green line), as well as corporate tax reform. In looking at the behavior of the ISM survey and earnings revisions around past recessionary periods in the US (shaded regions), it is difficult for us to foresee an imminent recession.
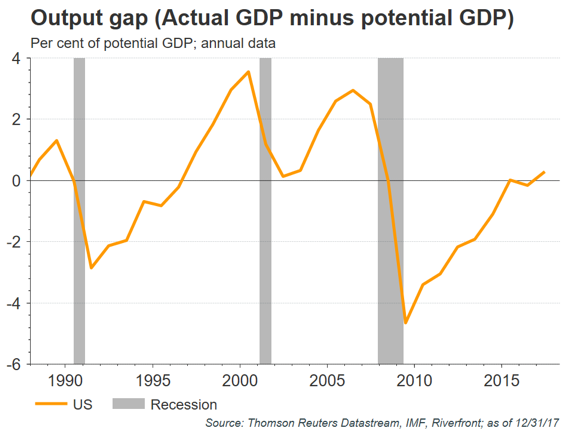
No Recession in Sight Yet: US Economy Not Overheated
When actual Gross Domestic Product (GDP) is meaningfully higher than potential GDP, an output gap is created. The output gap (orange line) represents the difference between an economy’s actual output versus its potential long-term output given its natural rate of unemployment.
A large output gap suggests the economy is ‘overheating,’ leading to inflation… and, with a lag, recession. We believe an overheated and declining output gap tends to lead recessions (shaded regions) by an average of more than 2 years.
As the chart pattern suggests, despite 8 straight years of recovery, the US economy is not yet ‘overheated’ and therefore recession risk appears low to us for now.
Monetary Policy Supportive
Interest Rates remain below 3% throughout the developed world. Low interest rates have historically been stimulative to economies because they encourage capital expenditures, hiring, investing and discretionary spending while discouraging savings.
Going forward, global Central Banks expect to keep monetary conditions relatively loose. They have noted that recent hikes in short-term interest rates and reductions in money printing programs were to remove ‘excessive accommodation’ and not to ‘put the brakes’ on their economies.

Source: Bloomberg. Data as of 6/29/18
Valuations not Excessive, In Our View
The chart on the right shows historical operating Price-Earnings (P/E) ratios for the S&P 500 in different 10-year bond yield environments. The black bar indicates the range of observations and the average is depicted by the blue triangle.
Historically, as growth has recovered, and yields moved higher, the S&P 500’s P/E has risen until investors begin to anticipate the next downturn in earnings. We expect continued earnings growth in 2018.
The S&P’s current 21x Operating P/E is at the upper end of the 15x – 21x range typical for 2-3% interest rate environments and near the middle of the 10x – 26x range for 3-4% rate environments.

Source: Standard & Poor’s and RiverFront. Data through December 2017.
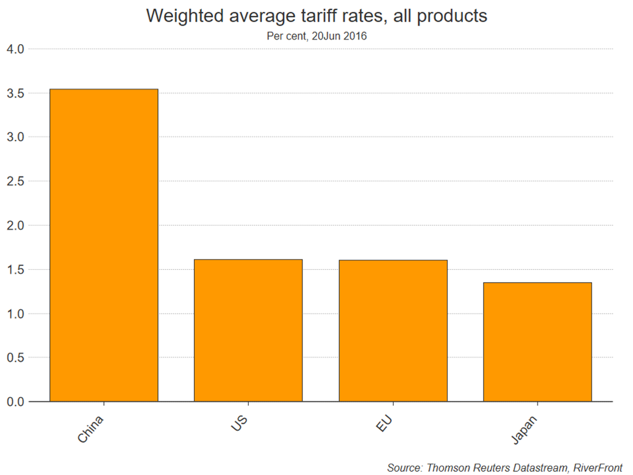
External Shock: US and China’s Trade Relationship in Focus
While we believe that protectionist trade policies, if fully executed, are a ‘lose-lose’ proposition, we are not yet convinced that the US and China are headed there – despite aggressive rhetoric from both sides.
Rather, we view both the US and China’s rhetoric as designed for maximum political effect. Behind the bluster, the world’s largest and second largest economies need each other– at least for the time being. Each country is the other’s largest trade partner; ~$600B total in trade.
We believe our current trade dynamic with China warrants a rethink. China routinely shows lack of respect for intellectual property, and, as the chart above shows, levies tariff rates on imports that are among the most severe among large economies.
Doug Sandler, CFA, is Global Strategist; Chris Konstantinos, CFA, is Chief Investment Strategist; and Rod Smyth is Director of Investments at RiverFront Investment Group, a participant in the ETF Strategist Channel.
Disclosures
RiverFront’s expectations and outlook discussed in this piece are based on information that is currently available to us, and in no way are a guarantee of how our strategies, the markets or specific securities will perform in the future. All comments refer generally to financial markets, and not RiverFront performance.