

Equity markets have entered a bear market over the last three months as the Federal Reserve (Fed) has raised the fed funds rate to slow the pace of inflation, in our view. Thus far the Fed’s efforts have not slowed inflation but have altered our three tactical rules of ‘Don’t Fight the Fed’, ‘Don’t Fight the Trend’, and ‘Beware of the Crowd at Extremes’. Currently, we believe our three rules are sending a defensive signal as both the Fed and Trend have turned against investors.
Don’t Fight the Fed: Not on Investors’ Side, In Our View
At the start of 2022, the Fed Funds target range was zero to 0.25%. Since then, the Fed has raised the Fed Funds Rate by 1.50% in increments of 0.25%, 0.50%, and most recently 0.75% on June 15th. The pace of the interest rate hikes has increased due to the unrelenting pressure of inflation. Headline inflation as measured by the Consumer Price Index (CPI), currently stands at a forty-year high of 8.60%, and the Fed has vowed to control rising prices with rate hikes. With four remaining Fed Open Market Committee (FOMC) meetings left in the year, financial markets are expecting an additional 2.00% -2.50% worth of rate increases. We believe the impact of the potential interest rate increases will serve as a considerable headwind for financial markets the remainder of the year; we anticipate higher interest rates should slow the components of GDP: consumption, inventory growth, trade, and government spending.
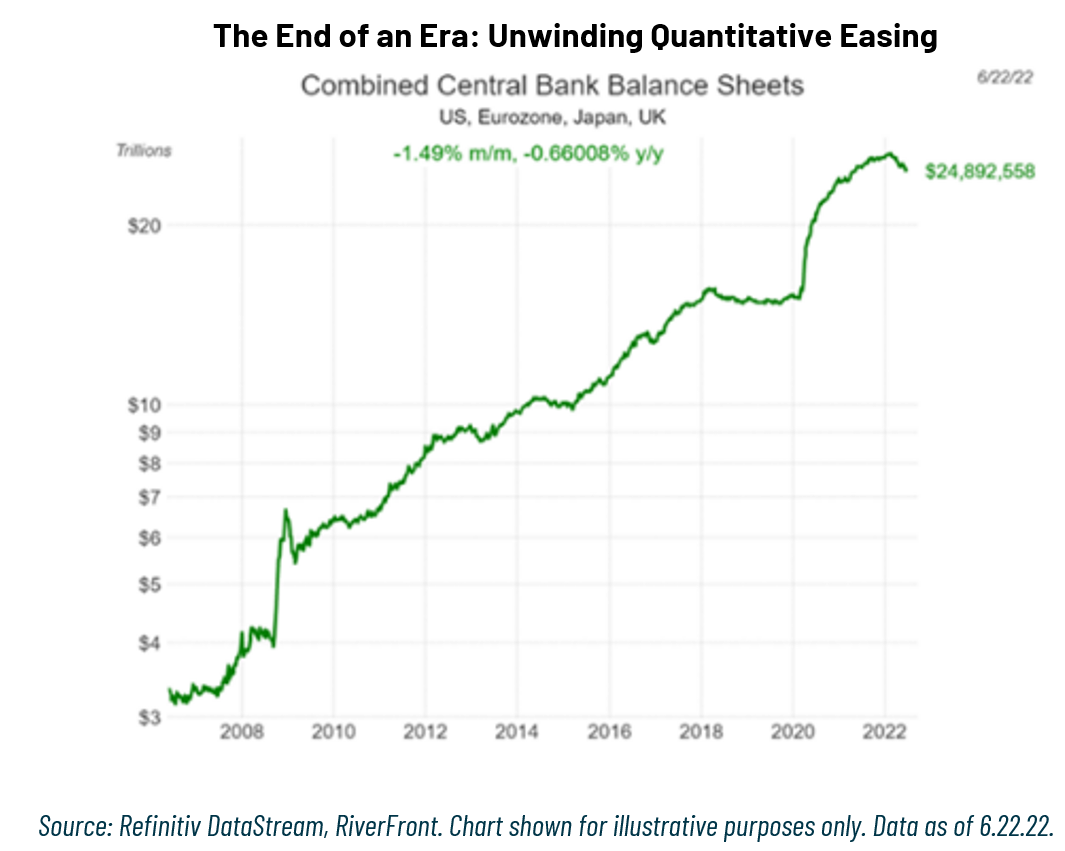
The Fed’s inflation fighting agenda is in sharp contrast to the stimulative agenda of the past thirteen years since the Financial Crisis of 2008. In addition to raising rates, the Fed is also employing Quantitative Tightening (QT) as it works to drain excess cash out of the financial system. It is doing this by reducing its roughly $8.9 trillion balance sheet by allowing Treasuries and Mortgage-Backed Securities (MBS) to mature. Hence, the Fed is no longer on the investor’s side, in our view.
Internationally, the central bank message is more mixed, as the Bank of England (BOE), the European Central Bank (ECB), and the Bank of Japan (BoJ) all are at varying stages of dealing with inflation.
Both the BOE and ECB have committed to fighting inflation by raising rates at varying speeds, whereas the BoJ continues to purchase bonds by holding ten-year yields at 0.25%. In aggregate, the combined central bank balance sheet size is starting to shrink (see chart, above) …thus we conclude that global central bankers are, in aggregate, no longer on the investors’ side.
Don’t Fight the Trend: No Longer the Investor’s Friend, In Our View
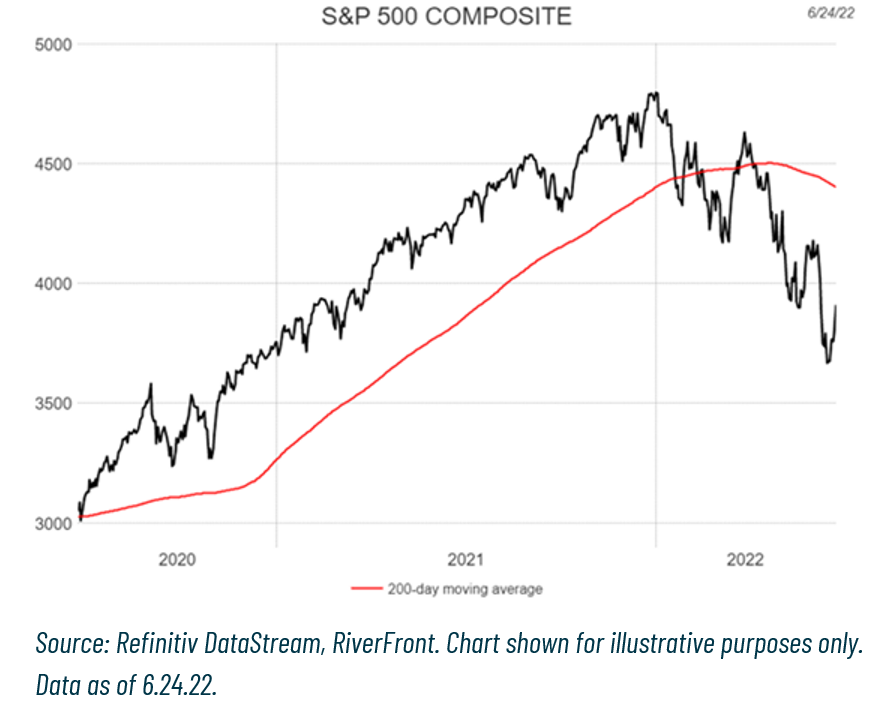
The S&P 500 has entered bear market territory after experiencing an 18.5% pullback year to date. The relentless downward pressure on stocks has the trend, as defined by the 200-day moving average, falling at a negative 13% to 14% annualized rate. From current levels, the S&P 500 must rise to 4500 and stay there for 18 days for the trend to turn positive. Given the magnitude that the US market will have to shift for the trend to turn positive, we believe that the trend will remain a headwind for the foreseeable future and is not the investor’s friend.
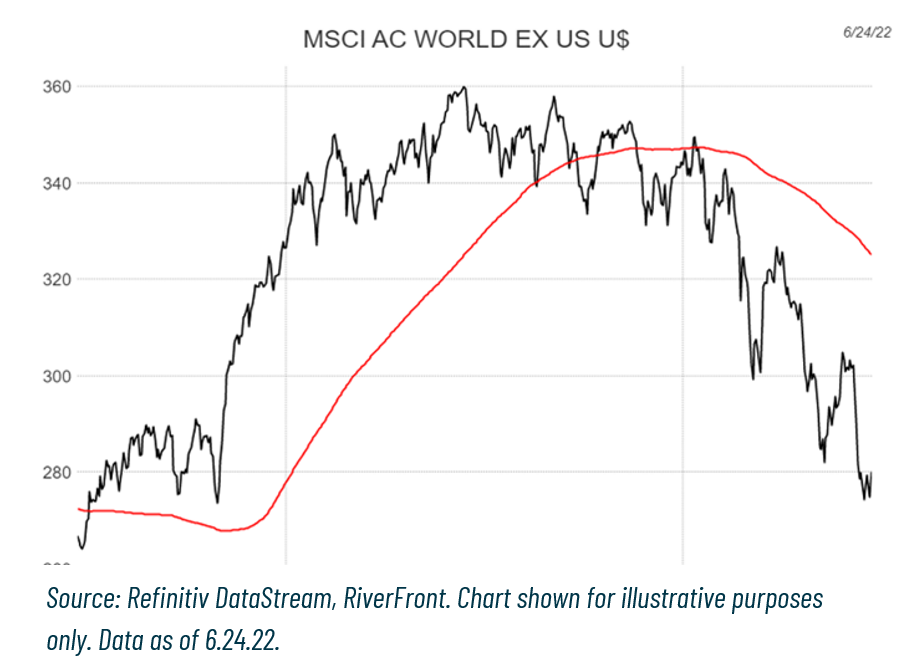
We come to the same conclusion on international stocks, as the MSCI All-Country World ex US trend is falling at a negative 18% to 19% annualized rate. Both markets are dealing with the impact of inflation and will struggle to find solid footing as central banks continue to be less accommodative, putting further pressure on stock valuations, in our view.
Beware of the Crowd at Extremes: We Believe Pessimism brings hope in Isolation
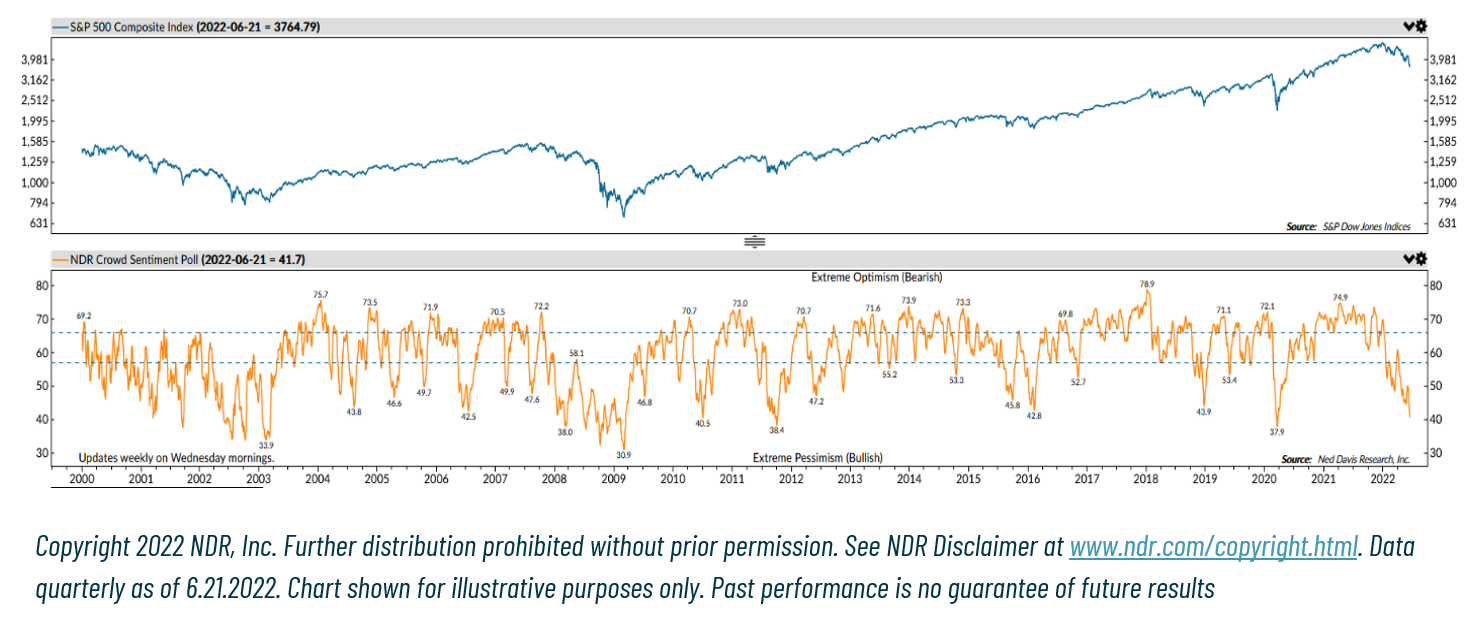
Since the beginning of the year, the Crowd has transitioned from the extreme optimism that was sparked by monetary and fiscal stimulus to extreme pessimism. The extreme pessimism of the Crowd is being driven by the Fed ending an era of ‘free money.’ Inflation is at a 40-year high, interest rates are rising with the 10-year Treasury yielding 3.13% as of June 24, 2022, up from around 1.51% as of the beginning of the year, and dwindling consumer savings relative to the peak of the pandemic. The extreme pessimism of the Crowd could be viewed as signaling a green light for equities. However, we have observed that durable market bottoms have typically occurred at more extreme levels of pessimism than what we’re currently observing on the NDR Weekly Crowd Sentiment Poll (see bottom panel of chart, above).
Last week, we saw a relief rally in US stocks due in part to sentiment being washed out. In our opinion, it appears like this is a bear market rally rather than a meaningful bottom. While stocks tend to have better returns when sentiment reaches extremely low levels, we cannot look at crowd sentiment in isolation. Looking through a quantitative lens by combining the trend and sentiment, our proprietary heat-map model indicates lower than average returns for the next 3 to 6 months.
Conclusion:
The three tactical rules individually are sending mixed signals. ‘Don’t Fight the Fed’ and ‘Don’t Fight the Trend’ are both giving us a red-light signal, whereas ‘Beware of the Crowd at Extremes’ is signaling a green light. When combined through a quantitative lens they send a clear message of caution. We believe the Fed is now walking a delicate tightrope and we see the economy slowing materially. Until there is greater clarity on the magnitude of the slowdown, we think the risk of recession is likely to dominate the headlines, creating the potential for further stock market declines. Therefore, we recently reduced risk in our balanced portfolios.
Important Disclosure Information:
The comments above refer generally to financial markets and not RiverFront portfolios or any related performance. Opinions expressed are current as of the date shown and are subject to change. Past performance is not indicative of future results and diversification does not ensure a profit or protect against loss. All investments carry some level of risk, including loss of principal. An investment cannot be made directly in an index.
Information or data shown or used in this material was received from sources believed to be reliable, but accuracy is not guaranteed.
This report does not provide recipients with information or advice that is sufficient on which to base an investment decision. This report does not take into account the specific investment objectives, financial situation or need of any particular client and may not be suitable for all types of investors. Recipients should consider the contents of this report as a single factor in making an investment decision. Additional fundamental and other analyses would be required to make an investment decision about any individual security identified in this report.
Chartered Financial Analyst is a professional designation given by the CFA Institute (formerly AIMR) that measures the competence and integrity of financial analysts. Candidates are required to pass three levels of exams covering areas such as accounting, economics, ethics, money management and security analysis. Four years of investment/financial career experience are required before one can become a CFA charterholder. Enrollees in the program must hold a bachelor’s degree.
All charts shown for illustrative purposes only. Technical analysis is based on the study of historical price movements and past trend patterns. There are no assurances that movements or trends can or will be duplicated in the future.
Index Definitions:
Standard & Poor’s (S&P) 500 Index measures the performance of 500 large cap stocks, which together represent about 80% of the total US equities market.
The Consumer Price Index (CPI) is a measure that examines the weighted average of prices of a basket of consumer goods and services, such as transportation, food, and medical care. It is calculated by taking price changes for each item in the predetermined basket of goods and averaging them. Changes in the CPI are used to assess price changes associated with the cost of living. The CPI is one of the most frequently used statistics for identifying periods of inflation or deflation.
MSCI ACWI ex USA Index captures large and mid cap representation across approximately 22 of 23 developed markets (DM) countries (excluding the US) and approximately 25 emerging markets (EM) countries.
In a rising interest rate environment, the value of fixed-income securities generally declines.
A basis point is a unit that is equal to 1/100th of 1%, and is used to denote the change in a financial instrument. The basis point is commonly used for calculating changes in interest rates, equity indexes and the yield of a fixed-income security. (bps = 1/100th of 1%)
Stocks represent partial ownership of a corporation. If the corporation does well, its value increases, and investors share in the appreciation. However, if it goes bankrupt, or performs poorly, investors can lose their entire initial investment (i.e., the stock price can go to zero). Bonds represent a loan made by an investor to a corporation or government. As such, the investor gets a guaranteed interest rate for a specific period of time and expects to get their original investment back at the end of that time period, along with the interest earned. Investment risk is repayment of the principal (amount invested). In the event of a bankruptcy or other corporate disruption, bonds are senior to stocks. Investors should be aware of these differences prior to investing.
The federal funds rate is the target interest rate set by the Federal Open Market Committee (FOMC). This is the rate at which commercial banks borrow and lend their excess reserves to each other overnight.
Investments in international and emerging markets securities include exposure to risks such as currency fluctuations, foreign taxes and regulations, and the potential for illiquid markets and political instability.
Don’t Fight the Fed – ‘Supportive’ means the Fed’s monetary policy regarding inflation and employment is in what we believe based on our analysis to be the investors’ best interest; ‘Against’ means the Fed’s monetary policy, in our view, is going against the investors’ best interest; ‘Neutral’ means the Fed’s monetary policy is neither supportive or against the investors’ best interest in our view. Don’t Fight the Trend – Terms correlate to the 200-day moving average as it relates to the equity indexes: ‘Positive’ means that the trend is rising, ‘Flat’ means the trend is flat, ‘Negative’ means the trend is falling. Beware the Crowd at Extremes – Terms correlate to the NDR Crowd Sentiment Poll and its measurement of Extreme Optimism (Bearish), Neutral, or Extreme Pessimism (Bullish).
RiverFront Investment Group, LLC (“RiverFront”), is a registered investment adviser with the Securities and Exchange Commission. Registration as an investment adviser does not imply any level of skill or expertise. Any discussion of specific securities is provided for informational purposes only and should not be deemed as investment advice or a recommendation to buy or sell any individual security mentioned. RiverFront is affiliated with Robert W. Baird & Co. Incorporated (“Baird”), member FINRA/SIPC, from its minority ownership interest in RiverFront. RiverFront is owned primarily by its employees through RiverFront Investment Holding Group, LLC, the holding company for RiverFront. Baird Financial Corporation (BFC) is a minority owner of RiverFront Investment Holding Group, LLC and therefore an indirect owner of RiverFront. BFC is the parent company of Robert W. Baird & Co. Incorporated, a registered broker/dealer and investment adviser.
To review other risks and more information about RiverFront, please visit the website at www.riverfrontig.com and the Form ADV, Part 2A. Copyright ©2022 RiverFront Investment Group. All Rights Reserved. ID 2261936