

Jonathan Bernstein, CIMA®, Principal, Director of Sales and Marketing
Recent market weakness has created a challenging environment for investors, especially for those with shorter time horizons that are preparing for or are already in retirement. It is easy to only think about the market relative to a recent high-water mark. Or, as the case has been recently, from near-term performance as we have seen an abundance of stimulus create a rising tide significantly higher than the long-term market averages would suggest over the past three years.
It can be difficult for even the most experienced investor to avoid uneasy feelings in the face of a market correction or even a bear market, which is a market decline of 20% or more. Behavioral finance teaches us that the human condition and our innate survival instincts can sometimes overwhelm and narrow our perspective. Even with all the information and data, it is common to still feel the instinctual compulsion to seek safety during times of perceived danger. In times of stress, these behavioral biases try to make sense of the available information and can form connections and correlations where none exist. This perfectly normal survival behavior has served us well in many instances but is not particularly helpful when investing. Legendary investor Warren Buffett has amassed much of his wealth by being fearful when others are greedy and greedy when others are fearful.
It is important to widen one’s perspective beyond the last month or the last quarter. The market has outperformed its long-term average by a wide margin for several years, which should be a consideration for investors that are believers of mean reversion. In fact, the average calendar year return for the S&P 500 Index going back to 1980 is what some might consider a respectable 10.68% despite that average being quite modest compared to the last few years. With a significant headwind of geopolitical and global health risks, the more recent three year’s average calendar return is a staggering 24.01%, which is more than double the long-term average since 1980.
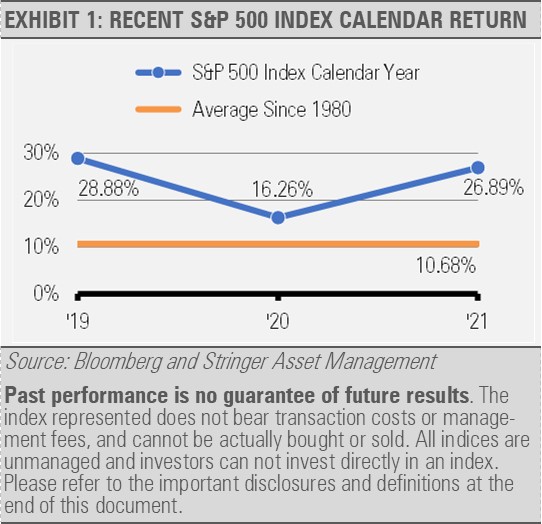
To provide further perspective, the market would need to finish the year down almost 30% to get the previous four year’s average calendar year return equal to the 10.68% long-term average.
That type of decline is not in our base-case forecast. Rather, we expect equity market returns over the next few years to be more muted than the last few years, thus reconciling the strong prior three year returns with the long-term average over time.
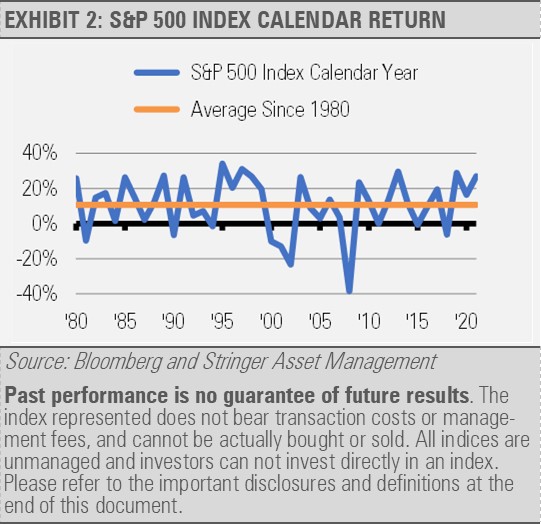
It may also be helpful to consider that markets almost never finish at or even near the long-term average. Since 1980, there were 18 instances of the S&P 500 Index finishing the year below 10.68% average and 24 occurrences of the S&P 500 Index finishing above the 10.68% average. Those below average years include four instances where the market finished at a loss greater than 10%. In short, investment markets have a decidedly upward bias over a long-time horizon though the markets can be extremely volatile in the short-term.
Lastly, many financial planners and investors agree on return assumptions that are far more conservative than the actual average broad market return. Those conservative estimates not only increase their probability of achieving a goal but also help assess the amount of risk one might need to take to achieve those goals. By taking a broader perspective and using conservative assumptions, the impact of a market correction, or even a bear market can be reduced, which can clear the way for more disciplined decision making that can potentially reduce errors caused by understandable and perfectly normal behavioral biases.
DISCLOSURES
Any forecasts, figures, opinions or investment techniques and strategies explained are Stringer Asset Management, LLC’s as of the date of publication. They are considered to be accurate at the time of writing, but no warranty of accuracy is given and no liability in respect to error or omission is accepted. They are subject to change without reference or notification. The views contained herein are not be taken as an advice or a recommendation to buy or sell any investment and the material should not be relied upon as containing sufficient information to support an investment decision. It should be noted that the value of investments and the income from them may fluctuate in accordance with market conditions and taxation agreements and investors may not get back the full amount invested.
Past performance and yield may not be a reliable guide to future performance. Current performance may be higher or lower than the performance quoted.
The securities identified and described may not represent all of the securities purchased, sold or recommended for client accounts. The reader should not assume that an investment in the securities identified was or will be profitable.
Data is provided by various sources and prepared by Stringer Asset Management, LLC and has not been verified or audited by an independent accountant.
Index Definitions:
S&P 500 Index – This Index is a capitalization-weighted index of 500 stocks. The Index is designed to measure performance of a broad domestic economy through changes in the aggregate market value of 500 stocks representing all major industries.