

By Charles Champagne, Vice President, Head of Portfolio Insights and Research Analytics, State Street Global Advisors
- Investors are using sector ETFs to capture marketplace trends — as the market turmoil persisted, investors upheld their highest active allocations in Communication Services and Utilities.
- As positioning remains somewhat defensive, it should not come as a surprise that, recently, Healthcare was the sector with the highest active allocation increase.
- In the fixed income space, investors hunting for yield increased duration and decreased exposure to high yield due to raising credit risk as ratings’ downgrade continued.
This post was written with contributions from Bartlomiej Szczurek, who is a Research Analyst on the SPDR Portfolio Insights and Research Analytics Team.
As clients want to fully understand the true nature of their portfolio exposures, the demand for our Portfolio Insight analysis remains steady. This service provided by SPDR ETFs offers our clients an in-depth view into their portfolios, as we analyze exposures and identify inadvertent risks in such areas as asset class, security type, sector, and duration buckets.
This service not only provides our clients with valuable insights into their portfolio allocations, but also it enables our team to draw conclusions on market trends coming from hundreds of aggregated portfolios. Our findings and observations from:
- Pre-COVID-19 — Mid-2019 to end of Quarter 1 2020 and
- Post-COVID-19 — April and May 2020
are summarized in this article. We examine the active weights of a portfolio versus the clients’ strategic benchmark and break down each sub-asset class. Our team also analyzes asset allocation positioning in pre-COVID-19 and post-COVID-19 periods.
Exchange traded funds defend the pole position
Exchange Traded Funds (ETFs) remain the most utilized investment vehicle in our clients’ portfolios, irrespective of business cycle and market condition. Throughout the pre-COVID-19 time period, the average ETF allocation within our clients’ portfolios was 64.41%, which has increased to 69.55% since the beginning of the pandemic. The analysis implies that the second-most often used vehicles were Open-End mutual funds, which made up 28.82% and 23.16% of average allocations, respectively. Almost 70% of ETF allocations were within equities, while mutual funds were used most often to acquire Fixed Income exposure, with an average allocation of 47.33%.
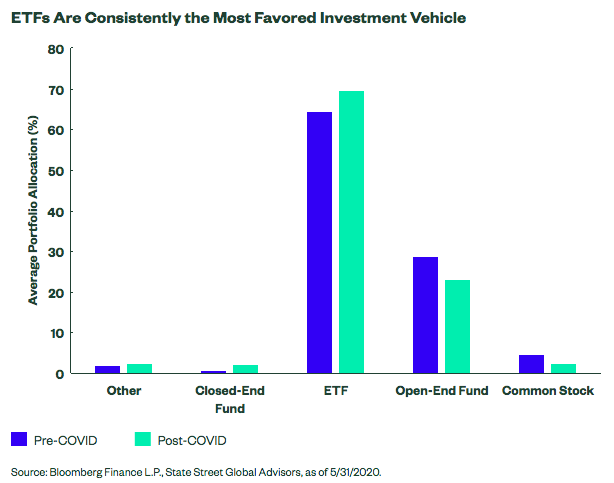
Our take: More investors have been turning to ETFs, particularly for their equity exposure and for reasons other than low cost, which supports their upward growth trajectory in recent years.
Equity: Defensive Positioning and Risk-off Sentiment Prevails
As the pandemic was spreading around the world, investors looked for a risk-off trade. Before the pandemic, active allocations in Equity and Fixed Income were already negative — -0.35% and -1.84%, respectively — and such trends continued as the market turmoil persisted. During the post-COVID-19 period, Equities were underweight -0.77%, while Fixed Income was -2.57% as a result of negative market sentiment. On the other side of the spectrum, there was a clear move into our Cash/Other bucket, which consists of cash/cash equivalents, Treasury bills, and commodities (consisting primarily of gold). The overweight grew from 2.20% to 3.35% in analyzed periods.
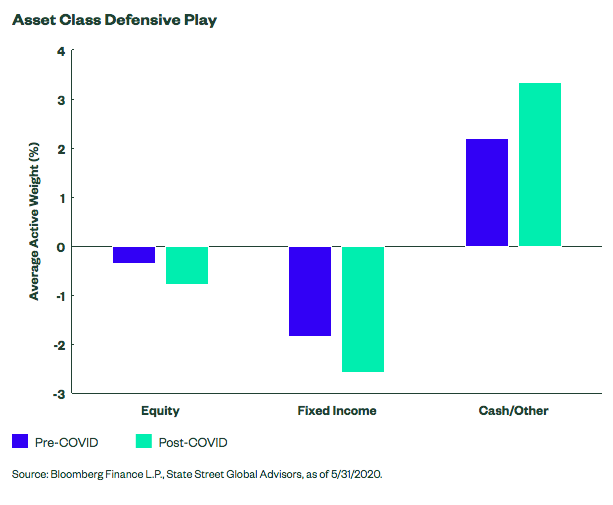
Our take: Market turmoil forces investors to reevaluate their risk profiles. Significant market uncertainty, unexpectedly high volatility and assets selloffs were drivers for investors to look for safe havens by underweighting risky assets and pile into cash holdings. Overweights in cash, T-bills and commodities (gold) might have been indications of defensive positioning as investors waited out distressed markets.
Sometimes convictions are best expressed with sectors
The strongest allocation conviction throughout the pre-pandemic period was in Telecommunication Services, with the average overweight relative to the clients’ strategic benchmark of 1.68%, which recently decreased to 0.85%. Client portfolios were also considerably overweight in Utilities — 0.79% — and Information Technology — 0.61%;however, the latter overweight reduced to nearly zero active allocation. The Healthcare sector was the most underweighted sector before the pandemic, but it gained the most active allocation weight in the post-COVID-19 period. In the post-COVID-19 period, investors switched the Financial sector from underweight -0.62% to overweight 0.20% and reduced underweight in Energy sectors from -0.37% to 0.1%, which signals investors’ emerging rotation into cyclicals.
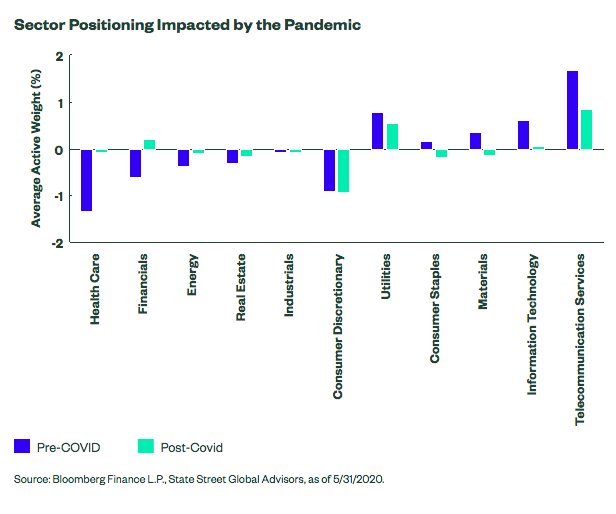
Our take: Our clients focus on the dispersion of returns and sectors’ cyclicality to determine tactical allocations and to capture trends in the market. The sector conviction during the post-COVID-19 period aligned with the overall sentiment of a market cycle. Investors upheld active allocations in Communication Services and Utilities, while at the same time, underweighting Consumer Discretionary and sharply rotating into Healthcare. All of these active allocations are signs of defensive positioning. The decrease in Information Technology active allocation is somewhat surprising, as software services were the primary means of communication during the pandemic, supporting businesses in remote work transition.
Transitioning to Regional Exposure Equality
In aggregate, the portfolios analyzed before COVID-19 were significantly underweight developed market equities, with an average underweight of -6.62% relative to the clients’ strategic benchmark, while the US market was overweight 7.82%. Throughout the pandemic, the active allocation weights range was reduced by almost a half for both.
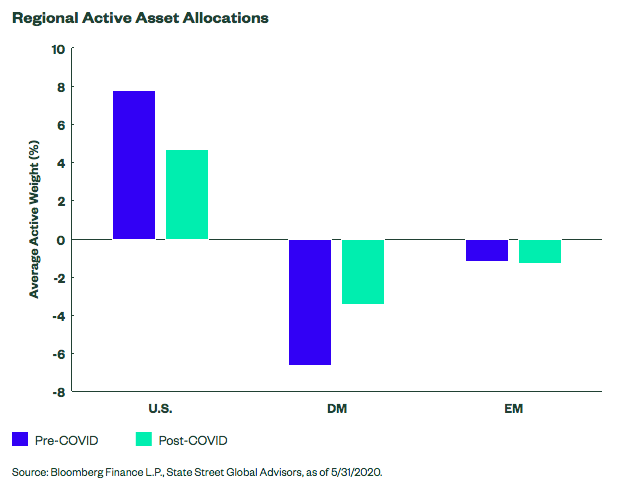
Our take: While the range of active allocations versus strategic benchmark decreased, our clients are still showing a home bias to domestic equities while potentially overlooking relative value opportunities and potential benefits of diversifying into foreign equities.
Fixed income: Shorter durations lose interest. Investors prefer safety over credit risk.
Within fixed income allocations, investors remained mostly overweight in ultra-short-term duration; however, the allocation decreased slightly during the pre- and post-pandemic periods. The 3–5 year duration bucket increased the most, with 5.27% of active allocation weight, while 10+ years increased by 1.84%, as investors sought long duration to mitigate equity volatility.
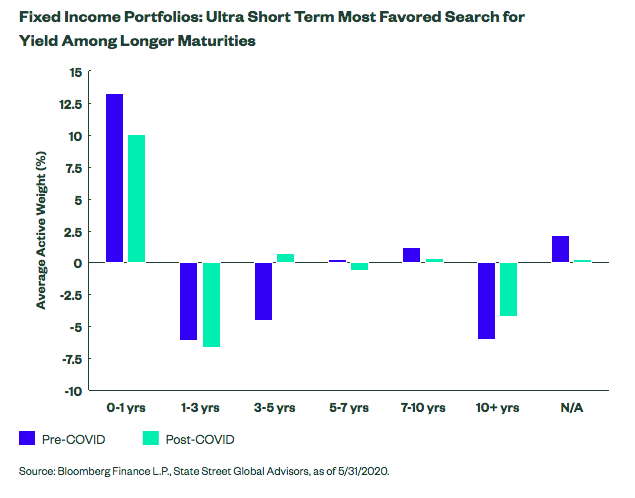
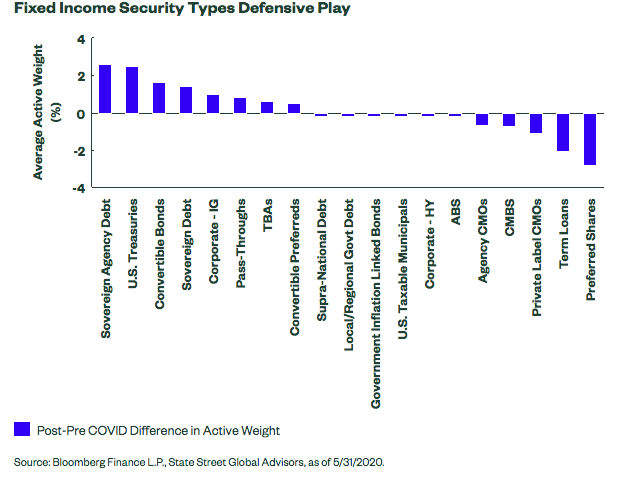
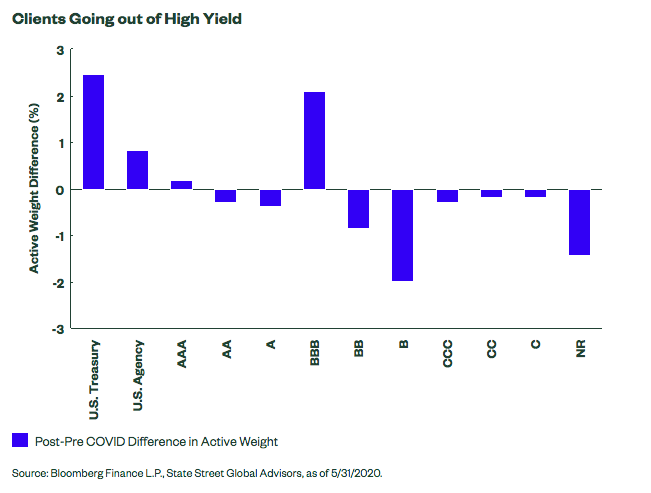
Our take: Clients’ portfolios fixed income allocations show clear evidence of risk-off sentiments, defensive positioning and a flight for safety by reducing high yield allocations. As the treasury yield curve continued to go down, investors took on slightly more duration risk. While investors increased active allocation in US Treasuries, they also increased Convertible Bond active allocation, which provides more income potential relative to other fixed income and sufficient downside protection relative to equities. Because more businesses are going online and more people are working from home, there are rising concerns about the future of commercial real estate, which were expressed by increased underweights in CMBS and CMO.
A holistic view of portfolio construction
Constructing the right portfolio allocation can be a complex endeavor — especially during stressed markets, as we recently observed. While markets face significant selloffs, volatility, and increasing liquidity risk, a lack of holistic evaluation can lead to unintended exposures and unwanted risks. At SPDR, we pride ourselves on providing tools and solutions to help construct tailor-made portfolios reflecting investors’ long-term objectives and risk profiles. For more information, please reach out to your SPDR sales representative.
View More Information About Our Firm:
FINRA’s BrokerCheckETFs trade like stocks, are subject to investment risk, fluctuate in market value and may trade at prices above or below the ETFs net asset value. Brokerage commissions and ETF expenses will reduce returns.
Standard & Poor’s®, S&P® and SPDR® are registered trademarks of Standard & Poor’s Financial Services LLC (S&P); Dow Jones is a registered trademark of Dow Jones Trademark Holdings LLC (Dow Jones); and these trademarks have been licensed for use by S&P Dow Jones Indices LLC (SPDJI) and sublicensed for certain purposes by State Street Corporation. State Street Corporation’s financial products are not sponsored, endorsed, sold or promoted by SPDJI, Dow Jones, S&P, their respective affiliates and third party licensors and none of such parties make any representation regarding the advisability of investing in such product(s) nor do they have any liability in relation thereto, including for any errors, omissions, or interruptions of any index.
Distributor: State Street Global Advisors Funds Distributors, LLC, member FINRA, SIPC, an indirect wholly owned subsidiary of State Street Corporation. References to State Street may include State Street Corporation and its affiliates. Certain State Street affiliates provide services and receive fees from the SPDR ETFs. ALPS Distributors, Inc., member FINRA, is the distributor for DIA, MDY and SPY, all unit investment trusts. ALPS Portfolio Solutions Distributor, Inc., member FINRA, is the distributor for Select Sector SPDRs. ALPS Distributors, Inc. and ALPS Portfolio Solutions Distributor, Inc. are not affiliated with State Street Global Advisors Funds Distributors, LLC.
THIS SITE IS INTENDED FOR QUALIFIED INVESTORS ONLY.
No Offer/Local Restrictions
Nothing contained in or on the Site should be construed as a solicitation of an offer to buy or offer, or recommendation, to acquire or dispose of any security, commodity, investment or to engage in any other transaction. SSGA Intermediary Business offers a number of products and services designed specifically for various categories of investors. Not all products will be available to all investors. The information provided on the Site is not intended for distribution to, or use by, any person or entity in any jurisdiction or country where such distribution or use would be contrary to law or regulation.
All persons and entities accessing the Site do so on their own initiative and are responsible for compliance with applicable local laws and regulations. The Site is not directed to any person in any jurisdiction where the publication or availability of the Site is prohibited, by reason of that person’s nationality, residence or otherwise. Persons under these restrictions must not access the Site.
Information for Non-U.S. Investors:
The products and services described on this web site are intended to be made available only to persons in the United States or as otherwise qualified and permissible under local law. The information on this web site is only for such persons. Nothing on this web site shall be considered a solicitation to buy or an offer to sell a security to any person in any jurisdiction where such offer, solicitation, purchase or sale would be unlawful under the securities laws of such jurisdiction.
Before investing, consider the funds’ investment objectives, risks, charges and expenses. To obtain a prospectus or summary prospectus which contains this and other information, call 1-866-787-2257, download a prospectus or summary prospectus now, or talk to your financial advisor. Read it carefully before investing.
Not FDIC Insured * No Bank Guarantee * May Lose Value