Pain Index: A Better Measure of Risk | Page 2 of 2 | ETF Trends

As a capital preservation metric, the pain index measures risk in losses. Specifically, it measures the depth, duration, and frequency of losses.

Measuring Risk in Dollars

In the below graph, the red line represents the peak-to-trough losses associated with the S&P 500 from July 1997 to July 2018. If one were to fill in the entire area between the drawdown line and the break-even line, it would encapsulate three things: the depth of losses, the duration of losses, and the frequency of losses. These three results are exactly what the pain index measures.

Historically, investors quantified risk in terms of standard deviation, more commonly referred to as volatility. Standard deviation is the most widely used measure of risk in the investing world. The omnipresent Sharpe ratio, which quantifies the risk-vs.-return trade-off, uses standard deviation as its measure of risk. Using volatility as the sole definition of risk, however, holds a number of flaws and can often be misleading and at odds with investors’ understanding of risk. If capital preservation is the primary concern of an investor, other metrics, like the pain index, provide a better measure of risk than standard deviation. Standard Deviation has Three Main Flaws: It fails to distinguish between upside and downside risk. By definition, standard deviation measures the volatility of individual returns around a mean return. Unfortunately, standard deviation makes no distinction between the “good” observations that fall above the mean and the “bad” returns that fall below the mean. Most investors would not punish a manager with a high standard deviation if a good portion of the volatility was upside volatility. The observations are viewed as independent when they clearly are not. The more significant failing of standard deviation is that it does not account for the timing of the negative returns. If, for example, a decade has half a dozen exceptionally bad months, standard deviation cannot differentiate whether or not these bad observations were randomly scattered throughout the decade or if they were all concentrated within a narrow time frame. Should the investor care about this flaw in standard deviation? Yes. Between 1989 and 2013, seven of the worst months in the entire 25 year range of the S&P 500 happened within July 2007 and February 2009—less than two year timeframe. A further twelve of the worst months of the last 25 years occurred during the dot-com bubble and the subsequent bear market at the start of the new millennium. Logically, this makes sense. In the midst of a crisis, the markets don’t hit a “reset button” and start afresh just because everyone flips the calendar ahead to a new month. A crisis will play out independent of a calendar, taking however long it will take. In the case of the S&P 500, compounding month after month of epic losses resulted in a maximum drawdown of over 50% between August 2007 and February 2009. And yet standard deviation treats those months as independent observations, each one distinct from the next. Investors don’t think of risk in terms of standard deviation. Most investors think of risk in terms of capital preservation—how much money they could potentially lose. It’s unlikely that many financial advisors field calls from angry clients asking, “What was my volatility last month?” It’s more likely most angry calls are phrased, “How much money did I lose?” Standard deviation is a classroom concept; capital preservation is a real-world issue. This is where the pain index comes in. Pain Index as a Better Measure of Risk Developed by Dr. Thomas Becker and Aaron Moore of Zephyr Associates, the Pain Index is similar to other measures of risk like standard deviation, beta, tracking error, etc. Where it differs, however, is in its definition of risk. As a capital preservation metric, the pain index measures risk in losses. Specifically, it measures the depth, duration, and frequency of losses. Measuring Risk in Dollars In the below graph, the red line represents the peak-to-trough losses associated with the S&P 500 from July 1997 to July 2018. If one were to fill in the entire area between the drawdown line and the break-even line, it would encapsulate three things: the depth of losses, the duration of losses, and the frequency of losses. These three results are exactly what the pain index measures.

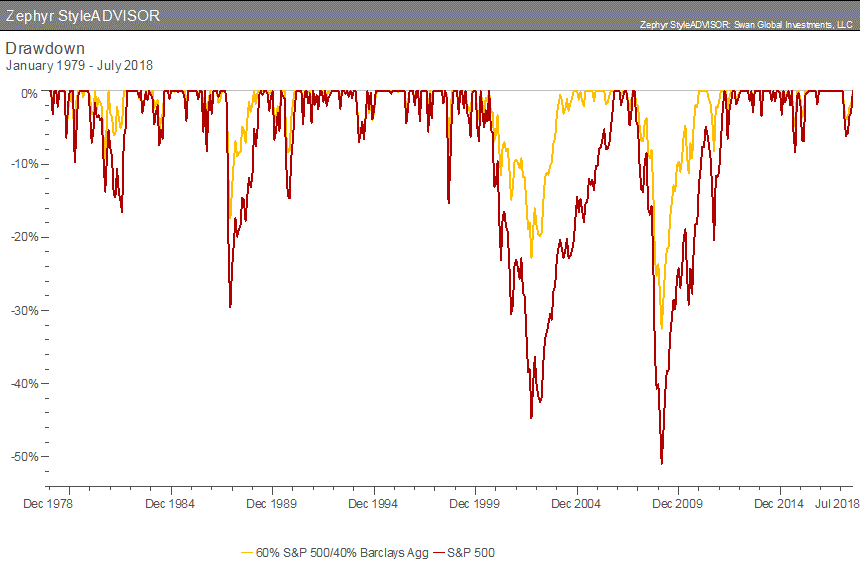
Source: Zephyr StyleADVISOR

The pain index essentially measures the “volume” between the break-even line and the drawdown line.  If the above lines are thought of as measuring cups, the pain index is the volume of liquid required to fill the drawdown space. The deeper the losses, the longer the losses and the more frequent the losses, the larger the volume of “pain.”

The steepest drawdown was the credit crisis of 2007-08 when the S&P 500 lost over 50%. However, the longest drawdown was the dot-com bust of 2000–2002. During that stretch, the market was down “only” 45% but took longer to recover its losses- 49 months for the dot-com bust, 37 months for the credit crisis, as we can see in the chart above.

Using the Pain Index Metric

When looking at the pain index measurement, the investor would prefer that volume to be as small as possible. The smaller the pain index, the better. A zero would be the best, indicating the manager never lost money.

The safest investments with the lowest pain indexes are likely to be those investments with scarcely any upside, like savings accounts, certificates of deposit, or money markets.

Measuring Risk how Most Investors Think about Risk

The pain index measures risk in terms most investors think about risk: how much money they might lose.

Putting risk in terms investors understand is important for helping them decide on funds and managers that suit their objectives and needs. Empathizing with their concerns and doing so with proper measurements can help you gain your clients’ trust and bolster your client relationship.

The pain index is great for investors who are more concerned with capital preservation above all else. But since investing is all about optimizing returns against risks, we ideally want a metric that measures the balance of the pain index against a measure of return. This is the purpose of the pain ratio, which I’ve discussed in a different post.

Marc Odo is the Director of Investment Solutions at Swan Global Investments, a participant in the ETF Strategist Channel.