

Economic Overview
 For the 3rd consecutive meeting, the US Federal Open Market Committee raised the short-term Fed funds rate by 75 basis points. This latest hike reinforced what has been one of the most aggressive series of rate hikes in modern times. Investors, meanwhile, remained focused on inflation-sensitive economic data in September, looking for signs that hawkish Fed policy was having an effect. While core inflation may have peaked, we have yet to see a meaningful decline in overall prices, with energy perhaps the exception.
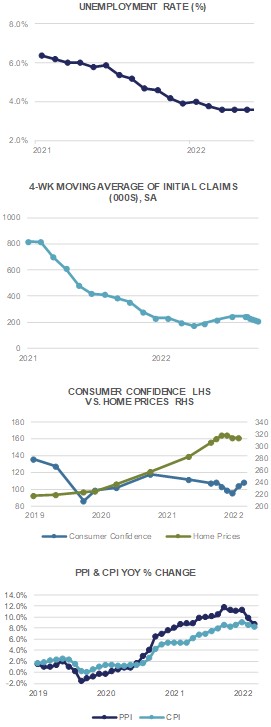
Consumer prices edged up +0.1% in August, while core CPI (ex food & energy) rose a greater than expected +0.6%. This translates into an +8.3% YoY move in headline inflation and a +6.3% YoY move in core CPI. Both numbers exceeded analyst estimates. At the producer level, we saw headline PPI drop -0.1% in August, while core PPI surged higher by +0.4%. On a trailing 12-month basis, producer prices are up +8.7% YoY while core PPI is higher by +7.3%. The Fed’s favored measure of inflation, the PCE Deflator, rose +6.2% YoY while the core Deflator is higher by +4.9% versus one year ago.
The one area where higher interest rates are beginning to have an impact is housing, with 30-year mortgage rates now firmly above 6%. The FHFA House Price Index dropped -0.4% in July, while the S&P CoreLogic CS 20-City HPI fell by -0.44%. Existing Home Sales fell by -0.4% in August while Pending Home Sale dipped -2.0%, for a YoY decline of -22.5%. Housing data tends to come with a 1 to 2 month lag and we would anticipate further declines in home prices and sales as move further into the fall season.
The FOMC’s aggressive rate tightening shows little sign of abating any time soon, at least according to FOMC members. Most support a terminal rate somewhere in the 4% to 4.5% range, with an intention of getting there sooner rather than later. With the old adage being that “the Fed tends to tighten until something breaks”, that “something” may be upon us shortly as volatility picks up and credit availability dissipates. More benign inflation readings may sway the Fed to ease up on the pace of hikes, but that data has not been reported yet.
Domestic Equity
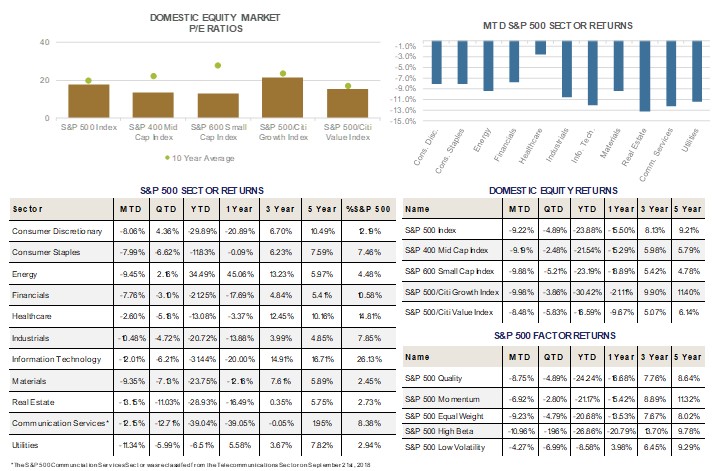
U.S. equities closed out the month of September on a low note, with the benchmark S&P 500 Index falling -9.2% on the month to close at 3,586. September’s closing print marked a new year to date low for the Index, which lost -4.9% during the quarter, and is down -23.9% for the year. Markets fell sharply in September as the Federal Reserve remained steadfast in its quest to quash inflation. The Federal Open Market Committee’s (FOMC) summary of economic projections showed a Committee that expects GDP growth to slow markedly in 2022, unemployment to tick up, and inflation to remain more elevated than previously projected. Taken together, the Fed’s outlook pushed short-term interest rates decisively above 4% (on both the 1- and 2-year Treasury), to the highest levels in 15 years, Treasuries now offer investors a compelling alternative for incremental dollars in the short-run, with the super majority of S&P 500 stocks now yielding less than short-Treasuries for the first time in more than a decade.
From a sector standpoint, all 11 sectors finished the month in negative territory. Healthcare was the notable standout losing only -2.6%, whereas other defensive sectors sold off with the market. Traditional defensive sectors such as Utilities and Consumer Staples lost -11.3% and -8.0%, respectively, as their dividend yields now appear less attractive than short-term Treasuries. The other notable laggard was Information Technology, which lost -12.0% on the month, as Apple underperformed the broader market during the period, despite having a positive return on the quarter.
With that said, equity valuations reflect not only the higher short-term yields mentioned earlier, but also a level of market uncertainty not seen in a long time. The S&P 500 trades at 15.1x 2023 earnings estimates, while the S&P 600 SmallCap trades at a mere 10.7x, both attractive starting points for long-term investors ahead of key company updates this month. Earnings season gets ready to kick off next week , and all eyes will be on forward guidance and whether 2023 bottoms-up earnings estimates are too high or not. They’ve remained somewhat resilient this year, only down about 4% from their highs; however, companies are likely to blame a strong USD (up 20% year to date) and a soft Chinese economy in their numbers, perhaps more so than blaming inflation in past quarters. How much of that is priced in already remains to be seen, given both are widely known at this point. When it comes to forward guidance, it also remains to be seen just how resilient the US consumer is, and whether or not corporate margins can hold up. If the consumer is still strong (consumption was positive within GDP in Q1 and Q2, despite headline contractions) and inflationary factors are receding, margins may come in better than feared. This remains of paramount concern for investors, as the questions of what multiple to use on what level of earnings both remain up for debate, resulting in a wider than normal range of S&P 500 price targets for the year ahead. Stay tuned.
International Equity
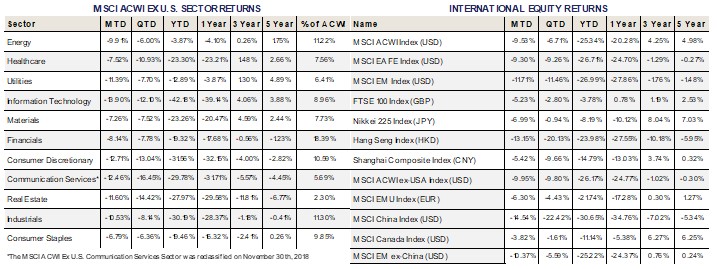
 International risk assets continued their decline during the month of September as the MSCI ACWI ex-USA Index fell -9.95% in USD terms. Emerging Markets (EM), as measured by the MSCI EM Index, fell -11.71% while Developed Markets (DM), as measured by the MSCI EAFE Index, fell -9.30%.
In the U.K., newly elected Prime Minister Lizz Truss announced a major spending program in an effort to offset rising energy prices. This, coupled with proposed tax cuts, set off a chain reaction sending the Pound to historic lows against the U.S. Dollar. In an effort to provide stability, the Bank of England announced that it will be purchasing up to £65 billion of U.K. government bonds, or gilts. This all comes as the Eurozone experiences 10% inflation. As we go to print, PM Lizz Truss has scrapped her plans for the tax cut. The FTSE 100 Index, which tracks the 100 largest companies listed on the London Stock Exchange fell -5.23% in GBP terms, add in the new lows for the Pound and the FTSE 100 lost -9.27% in USD terms during the month.
In another example of government intervention, the Bank of Japan spent ¥2.84tn ($19.7bn) in an effort to stabilize its currency against the U.S. Dollar. The action was temporarily effective as the Yen briefly surged to ¥140.34 to the Dollar but then fell to ¥144.60 late on Friday. The Yen selling has been driven by the BoJ’s ultra-loose monetary policy in an environment where almost all major Central Banks have become more restrictive in an effort to tame global inflation. Fears over a worsening recession and the weakening currency caused the Nikkei 225 Index to fall -6.99% in JPY terms and -10.85% in USD terms during the month, again highlighting the strength of the U.S. Dollar abroad.
The MSCI China Index posted a staggering -14.54% drop in USD terms during the month of September, contributing to EM’s underperformance relative to DM. Beijing’s Zero Covid quest, regulatory crackdowns, tensions with the West and a strengthening U.S. Dollar all contributed to the negative performance. Year-to-date, the Index is down -30.65% in USD terms.
Every MSCI ACWI ex U.S. sector posted negative returns during the month of September. The large st sector decline came from Information Technology, falling -13.90%, as rising rates continue to discount the earnings of Tech companies more than any other sector. As a result of rising rates globally, International Tech companies are down -42.18% year-to-date.
Fixed Income
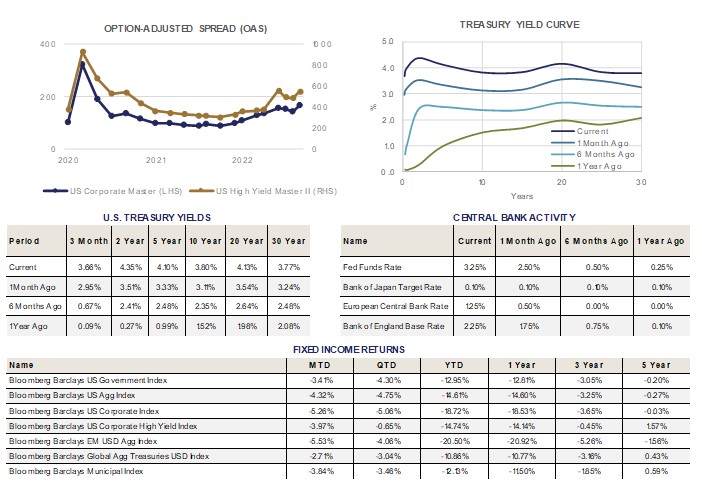
The Federal Reserve met this month, announcing an increase in the Federal Funds target interest rate on Wednesday, September 21st. They increased the target rate by 75 basis points, the third consecutive increase of that size. Chairperson Powell has remained focused in his recent public appearances, avoiding any mealy mouthed statements that allow market participants to speculate that the Fed will pivot in the near future and resume accommodative monetary policy. He made that mistake during his press conference after the July meeting, and it cost him and the Fed significant credibility.
The Fed’s aggressive stance against inflation pushed interest rates higher across the Treasury curve. Federal Reserve members now expect to raise the Federal Fund rate to at least 4% by year-end, from its current target range of 3%-3.25%. The dot plot of rate expectations also shows that the Fed expects rates to remain elevated throughout 2023. Participants’ GDP growth expectations were revised lower and unemployment expectations were revised higher. These changes are consistent with more restrictive monetary policy for an extended period.
Corporate credit spreads moved wider in September as the risk-off trend took over the markets. Investment grade corporate bond spreads charted new wides for 2022, surpassing the levels witnessed in June of this year. High Yield credit spreads remained slightly tighter than June levels, but are close to the widest levels experienced this year. The interest rate movement higher, combined with spreads moving wider, created a very difficult environment for corporate bonds in September. Investment grade bonds declined a little more than 5%, while High Yield fell close to 4%.
Municipal bonds slightly underperformed Treasury bonds in the month, with shorter maturity issues declining in price at a faster rate than equivalent maturity Treasury bonds. Even with this adjustment, short-maturity muni bonds remain less attractive than longer maturity muni bonds, relative to Treasury bond yields.
Emerging Market bonds continue to have a tough time in 2022, as riskier allocations underperform. The exposure declined over -5% in September, and has fallen over -20% year-to-date, the worst performer in each period.
Alternative Investments
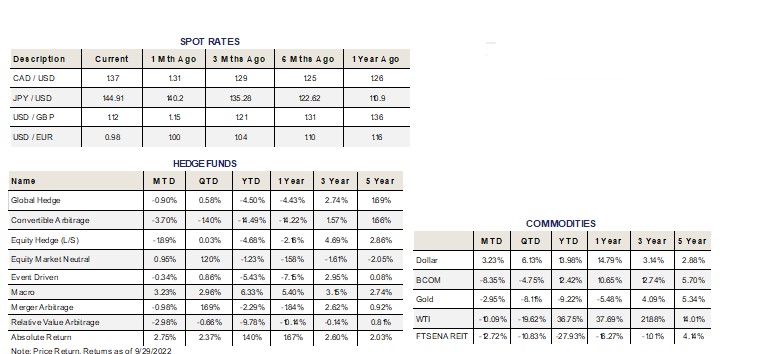
 Alternative investments were mainly negative in September as risk-off sentiment returned in the market and fears of a global recession grew.
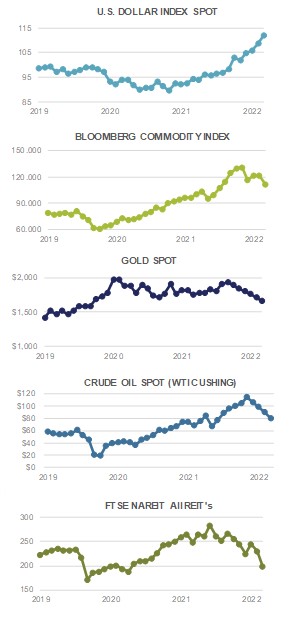
The US Dollar, as measured by the Bloomberg Dollar Spot Index, gained +3.23% in September and +6.13% during Q3. This is the best quarterly performance for the US Dollar since 2016 as the Fed continued to raise rates swiftly in response to stickier and higher than expected inflation. Additionally, the US Dollar’s reserve currency status led to its relative strength versus almost all other major currencies as global economic conditions worsened. The Dollar’s strength was a headwind for commodities as the Bloomberg Commodity Index finished the month down -8.35%.
Oil prices, as measured by WTI Crude Oil, declined -10.09% during the month and -19.62% for the quarter. Dollar strength, higher interest rates, and continued COVID lockdowns in China (the world’s largest crude oil importer) contributed to the decrease in demand and price decline. OPEC+ is meeting on October 5th and is expected to discuss substantial production cuts in an attempt to boost falling oil prices.
Europe remains in an economically vulnerable spot specifically when it comes to energy. The Nord Stream 1 and Nord Stream 2 natural-gas pipelines had multiple leaks in the same area during late September, which appeared to be targeted attacks caused by explosions. Although those particular pipelines were inactive, natural gas supply from Russia has already been substantially cut to Europe in recent months as a retaliation by Russia to the EU for supporting Ukraine. The attacks highlight the reliance of Europe on outside energy supplies and the tough situation the region faces as winter months approach.
ESG
 The Inflation Reduction Act (IRA) has been billed as the largest climate legislation in the history of the United States. The legislation included tax credits and incentives that aim to help companies fight climate change, increase energy efficiency, and spur more investments into renewable energy sources. This is perhaps the clearest confirmation that the energy transition is not dead, although due to global geopolitical uncertainties, it may have declined a bit in terms of priority.
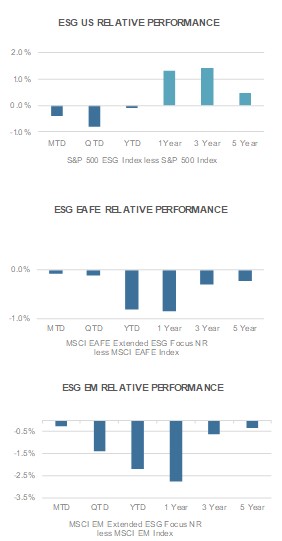
In September, the ESG integrated S&P 500, the ESG integrated EAFE, and the ESG integrated Emerging Markets exposures unperformed their non-ESG integrated counterparts. The ESG integrated corporate bond index also unperformed its non-ESG integrated benchmark in the month. This is the first time that we have seen such a broad based underperformance of the ESG integrated strategies.
The ESG aligned U.S. index underperformed its non-ESG counterpart by 39 basis points in the month of September. Year-to-date the ESG exposure underperformed by 10 basis points. The one year, three year, and five year time periods all remain additive to performance compared to the non-ESG aligned benchmark, strongly supporting ESG integration in portfolios.
ESG integrated EAFE returns experienced 8 basis points of underperformance in September. Year-to-date, the performance of ESG integrated EAFE trailed its benchmark by 81 basis points. Longer time periods also demonstrate some level of underperformance, with the three year and five year numbers being close to breakeven.
Emerging Markets ESG equity performance trailed its benchmark in September, underperforming by 25 basis points. This year has been particularly volatile in the Emerging Market category, reversing its strong track record of being accretive to performance. The year-to-date number shows 221 basis points of underperformance. All longer time horizons also currently trail the non-ESG integrated benchmarks.
ESG integrated fixed income returns experienced 6 basis points of underperformance in September. Year-to-date, the performance of ESG integrated fixed income trailed its benchmark by 8 basis points. The three year and five year return numbers continue to show outperformance for ESG integrated fixed income.

For more news, information, and strategy, visit VettaFi.com.