Streaming services may have very well changed the way we consume media forever, but that doesn’t always relate to the company’s stock being successful. If you have paid any attention to the news recently, or your credit card statement, you probably saw a lot of talk surrounding Netflix, the company’s recent earnings, and stock price. This is a good opportunity to make a small point: the shifts in leadership between supply and demand can be a leading indicator.
Our aim is not to debate the various pricing options of the streaming service or give an outlook of the company—we will leave that to the fundamental analysts. Instead, let’s talk about the price drop in Netflix’s stock. Netflix is not only in a bear market after a shocking earnings report, but it was already in a state of high volatility before announcing the loss of 200k subscribers in Q1. Volatility begets more volatility.
Netflix was the one of the “stars” of the pandemic, rising 131% off of its March 2020 low, more than doubling in stock price. Since its November 2021 high, the stock has now fallen -69% through Friday’s close, giving back all of the gains it has made since the year 2017. Three years of gains (+213%) was wiped away by a 69% drop in under six months. That is the power of negative compounding.
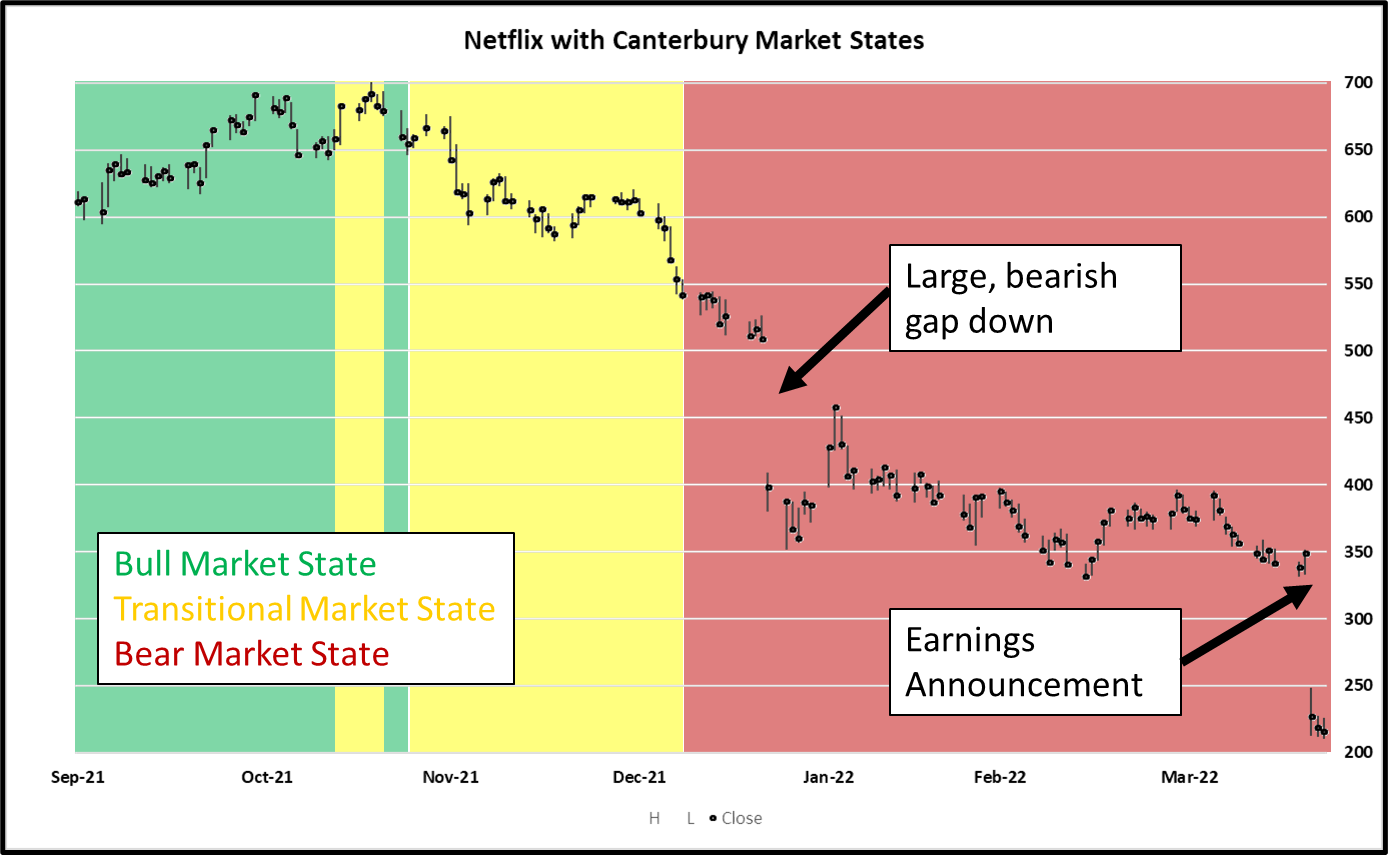
The side-by-side charts below show (1) Netflix since January 2018 and (2) Netflix Market State Environment in relation to the earnings announcement. Notice Netflix had been in a volatile bear market prior to the earnings announcement.
(2) Source: Canterbury Investment Management, using Canterbury’s proprietary technical “Market States”
The bottom line here is that volatility often precedes more volatility. Netflix stock had a large gap down to end 2021, prior to the gap down caused by the earnings announcement. Additionally, the stock had risen by more than 200%, which was wiped out in the last 6 months.
Market Sectors
The S&P 500 closed down for the 3rd straight week. Last week was quite volatile across the board. In 2022, tech-related stocks have been hit the hardest. Smaller sectors such as Energy, Staples, and Utilities have led. The table below shows how the average stock for each market sector has performed in 2022, as well where the average stock in each sector is relative to its respective 1-year high mark.
| Sector | Stock YTD Average | Stock Average off 52-week high |
| Information Technology | -18.40% | -26.93% |
| Consumer Discretionary | -15.68% | -26.64% |
| Communication Services | -10.19% | -27.39% |
| Financials | -6.35% | -17.53% |
| Health Care | -7.77% | -18.83% |
| Consumer Staples | 5.17% | -6.37% |
| Energy | 38.92% | -7.97% |
| Materials | 0.71% | -16.12% |
| Industrials | -7.54% | -17.74% |
| Utilities | 6.70% | -4.95% |
| Real Estate | -2.96% | -8.10% |
Source: Canterbury Investment Management using daily data from Yahoo Finance
The average stock from a technology-related sector (info tech, communications, and consumer discretionary) has been hit the hardest. On the contrary, the average stock from energy, utilities, materials, and staples is up on the year. This has been an advantage for adaptive portfolio management. In other words, there have been equities that have had favorable characteristics so far in 2022, that happen to be a small percentage of the markets. An adaptive portfolio has had the opportunity to rotate into these areas.
Bottom Line & Bear Markets
Here is the big concern for the markets right now. We just mentioned that there have been equity areas that have been in favor in 2022. We also briefly alluded to the fact that last week was volatile across the board. Given all the volatility experienced this year, Friday was the first day where every S&P 500 sector was down at least -1.50%. In other words, every sector had an outlier day. Bonds, often considered the “conservative” asset, were flat-to-down on Friday, as were commodities, so it can be generally presumed a lot of the selloff proceeds probably went to cash.
We have been dealing with a Bearish Market State since early February. Since then, volatility has created more volatility. The broad participation in the market’s selloff last week is a bit concerning. The best places in the market this year were impacted by the volatile swings last week. If this trend continues, most investors will struggle to find avenues that can protect their portfolio.
In other words, dealing with and navigating a bear market environment is a dynamic process. There are several investment tools available to do this, but portfolio management of these tools is crucial. Today, we have tools like inverse securities that can benefit from volatile fluctuation. As the market begins to show us where it wants to go, an Adaptive Portfolio will continue to make the necessary adjustments to limit the volatile market swings.
For more market trends, visit ETF Trends.