By Sean Clark, Clark Capital
Trade tariffs, feuds with the Fed, Russia investigations…
Today’s political environment is anything but ordinary, but with the major indices hitting new record highs in the U.S., it’s safe to say that the markets have been remarkably resilient in the face of uncertainty surrounding recent geopolitical events and the upcoming mid-term elections. The U.S. equity markets have climbed the “wall of worry” very well and sit poised for continued gains. But what else should investors expect ahead of this year’s mid-term elections?
Swinging Right or Left
Historically, the President’s party has tended to lose congressional seats, especially in the House of Representatives, which is currently what the polls are suggesting. Dating back to the 1902 mid-term elections, the president has lost medians of 28 seats in the House and four seats in the Senate. Republicans have lost fewer seats than Democrats, and contrary to political lore, losses have been smaller for first-term presidents than second-term presidents.
In the five cases of new Republican presidents, the Republican party lost a median of 18 seats in the House but gained one in the Senate. If historical precedent repeats, it would be enough for Republicans to maintain majorities in both the House and Senate. However, most polls have the Democrats picking up a majority in the House, with the Republicans holding onto the Senate.
Polls are a funny thing though, and if recent elections are any indication, the polls may not be accurate. Polls on both Brexit and the 2016 U.S. Presidential Election were wildly off. As such, we think the likely results will be more uncertain than the polls suggest.
Tracking the 4-Year Presidential Cycle
Mark Twain said, “History doesn’t repeat itself, but it does rhyme.”
In studying every mid-term election year dating back to the 1930’s, mid-term election years have typically experienced higher levels of market volatility compared to non-election years. A reason for this trend can be explained by the government typically removing stimulus during mid-term years. The normal pattern has been that stimulus is removed after the presidential election, through the post-presidential election year, and into the first half of the mid-term year. Stimulus has historically been pumped back into the economy starting late in the mid-term year, throughout the pre-election year, and well into the election year.
However, current government stimulus has not followed the historical pattern this cycle. Fiscal policy has been expansionary with President Trump’s recent tax cuts and even though the Fed continues its path of rate hikes, they have hardly been restrictive.
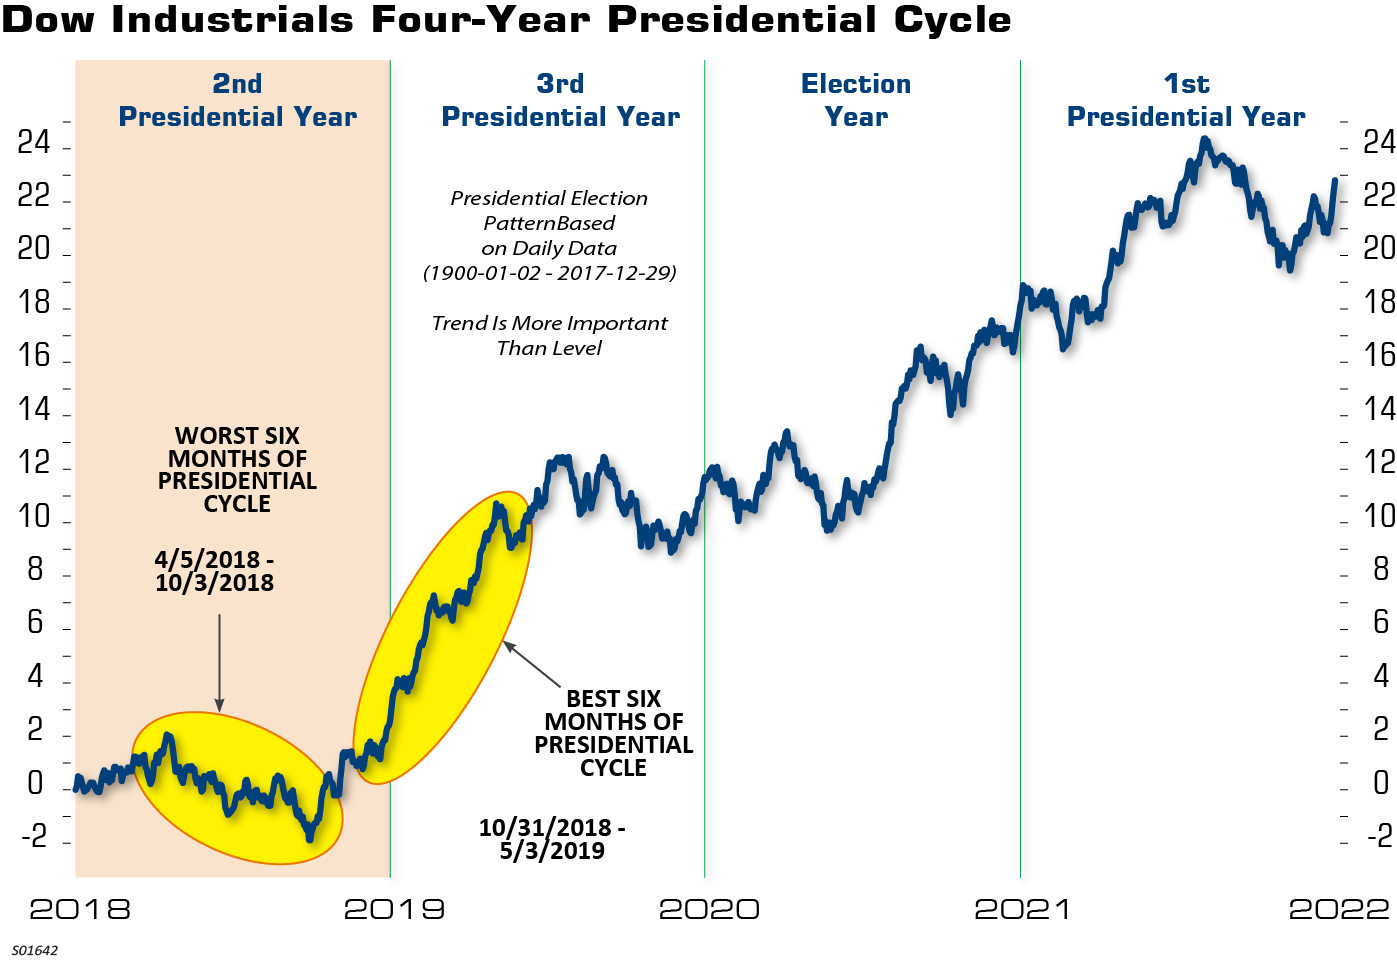
As shown in the chart below, we are currently in the worst six months of the presidential cycle—but it’s not all bad news for investors. In fact, history also shows us that the weakest six months of the presidential cycle are typically followed by the strongest. Since 1934, the average gain from the mid-term low to the high point in the following year is 47% and the average Post WWII gain for the S&P 500 in the mid-term election year is 6.7%, with a median gain of 11.4%.
![]()