Economic Overview
 The combination of higher interest rates, supply chain disruptions and China’s “Zero-Covid” policy may have finally tripped up the global growth machine, triggering an inexorable slide into economic recession. Q1’s surprise -1.6% Q/Q slide in US GDP may just prove the recession has already started here in the US and we well could be a majority of the way through it before it is formally recognized by the National Bureau of Economic Research (NBER). Sagging consumer confidence may portend a slowdown in consumer spending while warnings on hiring from corporate America are only just beginning.
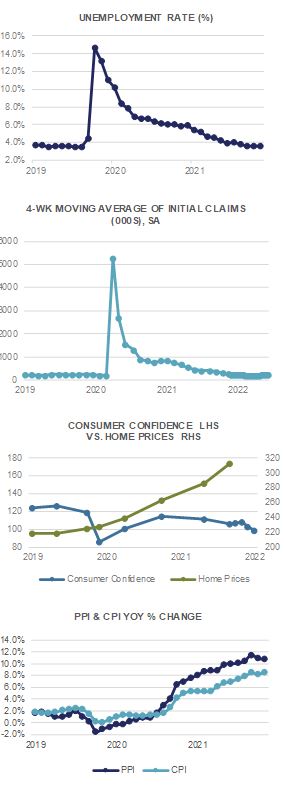
Inflationary pressures continue to plague the economy and show little sign of abating any time soon. Supply and demand imbalances remain across industries and extend from labor challenges to energy resources to semiconductor stocks. The Consumer Price Index for May rose a full +1.0% MoM and has surged +8.6% YoY. Stripping out food and energy, consumer prices rose +0.6% MoM and +6.0% YoY. Producer prices have surged even higher, rising +0.8% MoM in May and a staggering +10.8% from a year ago. Export prices rose +2.8% MoM and are now up +18.9% YoY, largely reflecting the rise in energy and commodity prices.
The labor market remains strong for now, although we’ll be watching for an uptick in Initial Jobless Claims for signs of a deteriorating jobs market. The Unemployment Rate for May came in at 3.6%, while weekly Initial Jobless Claims numbers held steady around 230k. The latest JOLTS Job Openings survey indicated 11.4 million jobs available, while the US Labor Force Participation Rate has ticked up to 62.3% but remains below pre-pandemic levels. Average Hourly Earnings rose +0.3% in May and are now up +5.2% YoY.
Housing is beginning to feel the impact of higher interest rates as the average 30-year mortgage rate ticked above 6.0% in June. Although the overall stock of housing remains below aggregate demand here in the US, input costs as well as financing costs are catching up to potential buyers. Housing Starts fell -14.4% in May (MoM) while Building Permits dropped -7.0%. New Home Sales surged an unexpected +10.7% MoM, although Existing Home Sales declined by -3.4%. Despite a continued rise in April for the S&P CoreLogic CS 20-City home price index (+1.8% MoM and now +21.2% YoY), we wouldn’t be surprised to see some softening ahead.
The US Federal Reserve remains committed to raising short-term interest rates after June’s 75 basis point hike. All indications point to another ¾ point rise at the July meeting, while the Dot Plot suggests a year-end level for the Fed Funds rate closer to 3.5%. Slowing economic growth may scuttle those plans; however, Chair Powell has indicated that defeating inflation is the Fed’s one and only priority right now and that may have to come at the expense of full employment. Time will tell.
Domestic Equity
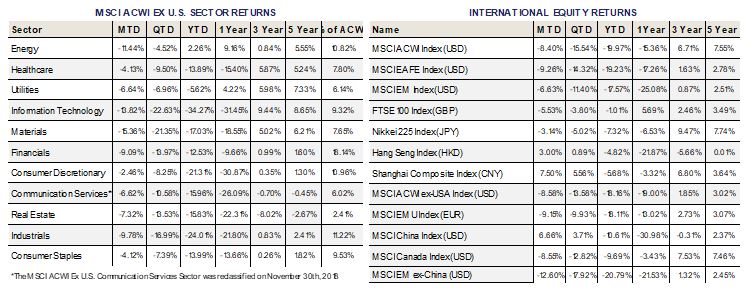
U.S equities ended the month of June on a low note, bringing to an end a volatile first half of the year that saw the benchmark S&P 500 fall -20.00% to close at 3,785. For the month of June, Large-Caps shed -8.26%, bringing the quarterly tally to -16.10%. Small- and Mid-Caps, as measured by the S&P 600 and 400 Indices lost -8.55% and -9.62% during the month, faring slightly worse than their Large-Cap counterparts. For the quarter, Small-Caps fell -14.13%, bringing their year to date return to -18.97%. Performance of Mid-Caps was not too dissimilar, falling -15.44% on the quarter, and -19.57% on the year. Equity markets have largely been indiscriminant in their selling, with US Large-, Mid-, and Small-Caps all performing roughly in line with each other this year.
At the sector level, defensive areas of the market continued to outperform as recession fears have mounted. Consumer Staples, Healthcare, and Utilities were the best performers on the month, falling -2.50%, -2.66%, and -4.98%, respectively. Bottom performers included Energy, Materials, and Financials, which lost -16.80%, -13.84%, and -10.90%, respectively. Despite being the month’s worst performer, Energy remains up +31.64% year to date, largely on the back of higher earnings per share (EPS) estimates. Supply and demand dynamics remain tight, with demand rebounding strongly and supply barely budging. Much attention is placed on the price per barrel of West Texas Intermediate (WTI) crude oil, which is off more than $25 from its highs this year. WTI is likely to continue to be impacted by slowing global growth and relaxations of COVID-19 restrictions in China, adding to price volatility in the back half of 2022.
Underscoring the defensive posture of the market, Utilities (+14.29%), Consumer Staples (+6.66%),, and Healthcare (+3.37%), are the top performers over the past year excluding Energy, which remains in the poll position, up +39.55% over the past year.
From a style perspective, Growth stocks, as measured by the S&P 500 Growth Index, lost -8.28% on the month, closing out a difficult first half of the year with a -27.62% drop. On the other hand, Value stocks, as measured by the S&P 500 Value Index, lost -8.24% on the month, and have only lost -11.42% year to date, a more than 16 percentage point out performance compared to Growth.
Looking ahead, valuations look compelling in the Small- and Mid-Cap space, with both the S&P 600 and 400 Indices trading at trailing P/E multiples of ~13x, along with forward estimates closer to ~11x, both historically attractive compared to themselves and to Large-Caps. For investors with a long-term time horizon, the SMID-Cap space looks the most attractive it has in the past 25 years outside the financial crisis of 2008-2009. Stay tuned.
International Equity
 International equities wrapped up June in the red, with both Developed (DM) and Emerging Markets (EM) equities posting declines. DM equities, as measured by the MSCI EAFE Index, were hard hit, falling -9.26% during the month. EM equities, as measured by the MSCI EM Index fared slightly better, down -6.63% during the month. For the quarter, DM and EM fell -14.32% and -11.40%, respectively, outperforming US equities. For the year, DM and EM have also fared better, falling -19.23% and -17.57%, respectively. Global equity markets have largely been indiscriminant in their selling, with US Large-, Mid-, and Small-Caps all performing roughly in line with DM and EM benchmarks.
At the regional level, the Eurozone, as measured by the MSCI EMU Index, has quietly outperformed, falling -9.15% in June. For the year, the Eurozone is down -18.11%, despite the geopolitical headwinds facing the bloc. Additional new headwinds likely remain, including French President Macron losing a majority of parliament, a hawkish European Central Bank (ECB) contending with rising bond yields in Italy, and the unforeseeable consequences of both Sweden and Finland joining NATO. With inflation accelerating and energy prices surging, the Eurozone’s headwinds are perhaps a bit different than those in the U.S. due to the lack of available tools to combat them, specifically on the energy side.
At the country level, Canada was a relative outperformer despite oil prices receding from their highs. The MSCI Canada Index lost -8.55% in USD terms, slightly outperforming DM. It should be noted that Canada is a unique example of a country that is not included in either DM or EM benchmark, and has handily outperformed DM YTD, down only -9.69%.
Within EM, China was a notable standout in June, with the MSCI China Index gaining +6.66% in USD terms. June marked the end of Shanghai’s two-month lockdown, relaxed travelling restrictions, the re-opening of Shanghai Disney, and a visit from President Xi to Hong Kong. While anecdotal, all point to a relaxing of COVID-19 restrictions, even though not an outright end to “Zero-Covid” policy. While not without their own unique risks, Chinese equities are becoming more attractive on a relative basis as additional stimulus measures are embraced, whereas most of the rest of the world is tightening monetary conditions.
Rounding out Asia, Japanese equities, as measured by the Nikkei 225 Index, lost -21.32% in USD terms, as the Bank of Japan (BoJ) continued its embrace of “Yield Curve Control” at its June 17 meeting. The BoJ has pledged to buy “unlimited” Japanese Government Bonds (JGBs) at a 10-year yield of 0.25%. In a record purchase, the BoJ bought $81 Billion in JGB’s in a single week. With that, the Yen continues to fall sharply versus the Dollar, adding to unhedged losses, hitting a new decade high of 136 JPY/USD. Interest rate differentials continue to drive the Yen lower versus the Dollar, and will likely continue doing so absent a change in BoJ policy, or a sharp decline in U.S. bond yields.
Fixed Income
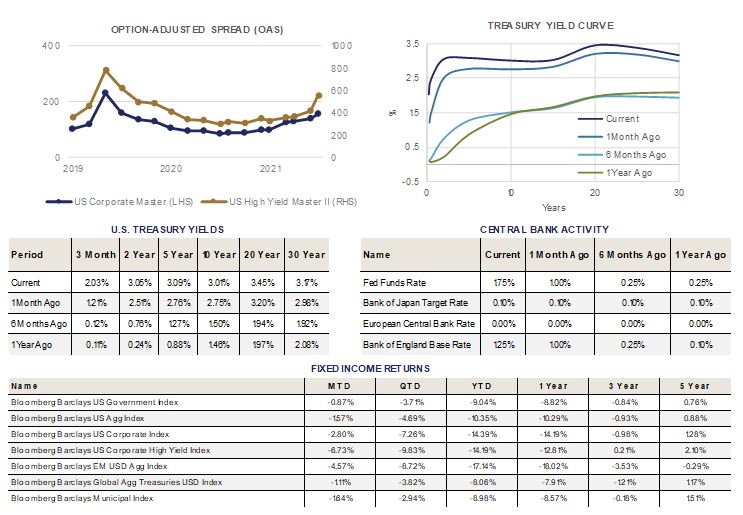
The latest Federal Reserve meeting took place on June 14th and 15th. When it wrapped up, the Fed announced that they would be raising the federal funds rate by 75 basis points. This was the level that the market had priced in rapidly just days before it was announced. Prior to this repricing, the market had expected a more modest 50 basis point increase. The more aggressive Fed posturing was driven by the CPI inflation reading coming in higher than expected in June. Expectations are for the Fed to continue to aggressively tighten monetary policy until inflation begins to recede, and the job market cools a bit.
Treasury yields moved higher in the month of June. This move was most acute in shorter maturity bonds, with the 6-month maturity rising the most, followed by the 12-month maturity. Longer dated bond yields increased modestly, after falling late in the month. Even with the rise in rates, the Government bond index led the way in performance due to avoiding the negative impact of spread widening on the other indices.
Investment grade corporate bond spreads widened this month. The spread widening headwind was magnified by the move higher in interest rates, putting downward pressure on corporate bond prices and causing their performance to lag behind the Government and Aggregate indices.
High Yield spreads also moved wider in June. This move was more aggressive than what was experienced by the investment grade corporate bond market. Spread widening combined with the rise in interest rates left High Yield returns trailing the pack in June, and near the bottom year to date. As recession concerns continue to grow, it is not surprising to see credit spreads widen. Current levels are consistent with an economic slowdown, but do not yet appear to fully price in a recession.
Municipal bonds have had a volatile 2022. The month of June was a strong one, offering performance trailing only the Government bond index. Performance year to date, while negative, remains one of the stronger areas of the bond market. While munis have shown relative strength during a difficult period for bonds, they remain at attractive valuations. Intermediate and longer-term municipal bonds maturities currently offer tax-free yields that approach those offered by taxable treasury bonds. They also offer diversification within bond portfolios, and access to high credit quality issuers.
Alternative Investments
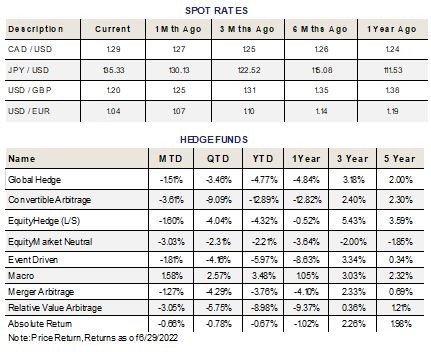
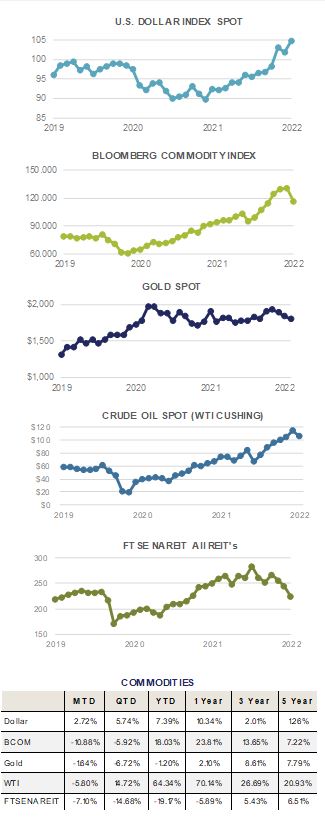 Alternative investments were mainly negative in June as they were hurt by a stronger US Dollar and broad sell-off in risk assets due to growing recession fears. Commodities, as measured by the Bloomberg Commodity Index, were down -10.88% for the month. However, they remain up +18.03% YTD, outperforming most major equity and fixed income indices for the period.
The Federal Reserve pivoted to a more hawkish rhetoric recently and has finally shown a willingness to raise rates at a quicker pace in an attempt to curb inflation. Energy and agricultural product supplies remain tight globally but investors are now weighing whether rising rates may trigger a recession and cut demand for these products.
Energy prices slightly cooled off during the month, but remain sky high compared to a year ago. WTI crude oil finished down -5.80% during June, closing at $105.76 per barrel. This hasn’t helped US consumers much as the national average price per gallon of gas was $4.857 as of month end, which is more than a 50% increase from prices seen at the pump a year ago. US natural gas futures dropped 33% during June due to inventory rising and projected mild weather conditions in July. In addition, Freeport LNG’s gas export plant in Texas will be shutdown longer than expected following a plant fire allowing utilities to stockpile more fuel.
Gold finished the month down -1.64% and the quarter down -6.72%. Despite its reputation as an inflation hedge, a rising US Dollar and rising bond yields have been headwinds for the precious metal. Gold still remains a solid portfolio diversifier and its relatively flat YTD performance has held up well compared to most major asset classes.
In contrast, copper was down -12.59% in June and closed the month at a 52 week low of $8,258 per ton, as measured by the LME Copper 3-month Rolling Forward contract. Copper is widely regarded as a reliable gauge for global economic activity so the decrease in its price and its relative performance versus gold will be an interesting indicator to monitor.
ESG
 In a year where energy/commodity related investments are one of the only areas that have offered positive returns, ESG integrated investments have continued to struggle. Carbon intensive exposures have rallied while lower carbon footprint businesses have struggled. Rising inflation/interest rates have intensified the effect of this performance shift.
Institutional and individual investor interest in the area continues to grow, as does the growing regulatory framework for related disclosures and information sharing. When the volatility of the current market machinations is behind us, the focus on the future will return. The need for global cooperation to create a more sustainable planet remains. While the path forward has become significantly more complicated, it still needs to be pursued.
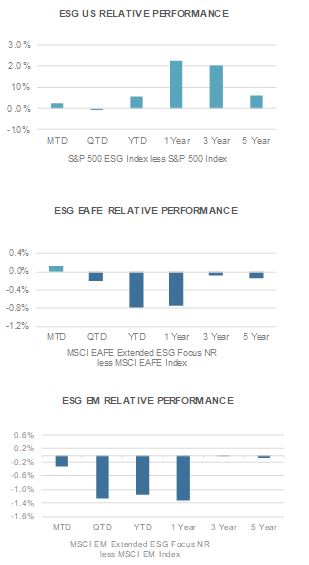
2022 returns for the ESG equity indices continue to struggle. In June, the ESG integrated U.S. and EAFE returns beat their respective benchmarks. ESG integrated Emerging Markets underperformed its non-ESG integrated counterpart in the month. ESG integrated corporate bond index also unperformed its non-ESG integrated benchmark in June.
The ESG aligned U.S. index outperformed its non-ESG counterpart by 23 basis points in the month of June. For the quarter, the ESG exposure did trail by 2 basis points. Year to date the ESG exposure outperformed by 57 basis points. The one year, three year, and five year time periods all remain additive to performance compared to the non-ESG aligned benchmark, strongly supporting ESG integration in portfolios.
ESG integrated EAFE returns experienced 12 basis points of outperformance in June. For the quarter, the ESG exposure underperformed by 21 basis points. Year to date, the performance of ESG integrated EAFE trailed its benchmark by 79 basis points. Longer time periods also demonstrate underperformance, making the EAFE allocation the toughest area to find support for ESG integration with the current return data.
Emerging Markets ESG, underperformed the benchmark by 33 basis points in June. For the quarter, the ESG exposure underperformed by 127 basis points. The year-to-date number shows 116 basis points of underperformance. All longer time horizons also currently trail the non-ESG integrated benchmarks.
ESG integrated Investment Grade corporate bonds underperformed their non-ESG equivalent by 2 basis points in June. Year to date ESG integrated IG bonds also slightly trail their non-ESG benchmark, lagging by 4 basis points. All longer time periods continue to show outperformance by the ESG focused corporate exposure, and remain strongly supportive of ESG integration into fixed income portfolios.


