

When it comes to markets, history rarely repeats itself, but it can rhyme.
If you haven’t noticed by now, we are in the middle of a bear market. Six months ago, the S&P 500 was sitting at a new all-time high. Now, six months into 2022, and we have seen the 3rd worst first half of the calendar year for the market index since 1950. Through the end of June, the S&P 500 had fallen -20.57%. Only two other first six month periods were worse: the starts of 1970 and 1962.
Entering into 1970, the market index was already in a bear market, and well off of its previous high-water marks. For that year, volatility just continued to climb, and the index continued its downward trend. Looking at 1962, however, there are many characteristics that have been similar to the beginning 2022. Here are some of those similarities:
- The market in 1962 was coming off of a new high. The S&P 500 put in a new high in mid-December 1961. In 2022, the market put in a new high on January 3rd.
- Volatility had been low the previous year. According to the Canterbury Volatility Index (CVI), volatility had been as low as CVI 42 in 1961. In 2021, volatility reached a low point of CVI 48. Both qualify as “extreme low” volatility.
- In the first 6 months of 1962, the S&P 500 fell -23.50%. Through the first 6 months of this year, the S&P 500 was down -20.57%.
- Volatility peaked out at CVI 140 in June of 1962. As of June 30th, 2022, volatility measured CVI 140.
The chart below shows a comparison of the S&P 500 for the two time periods (First 6 months of 2022 and First 6 months of 1962).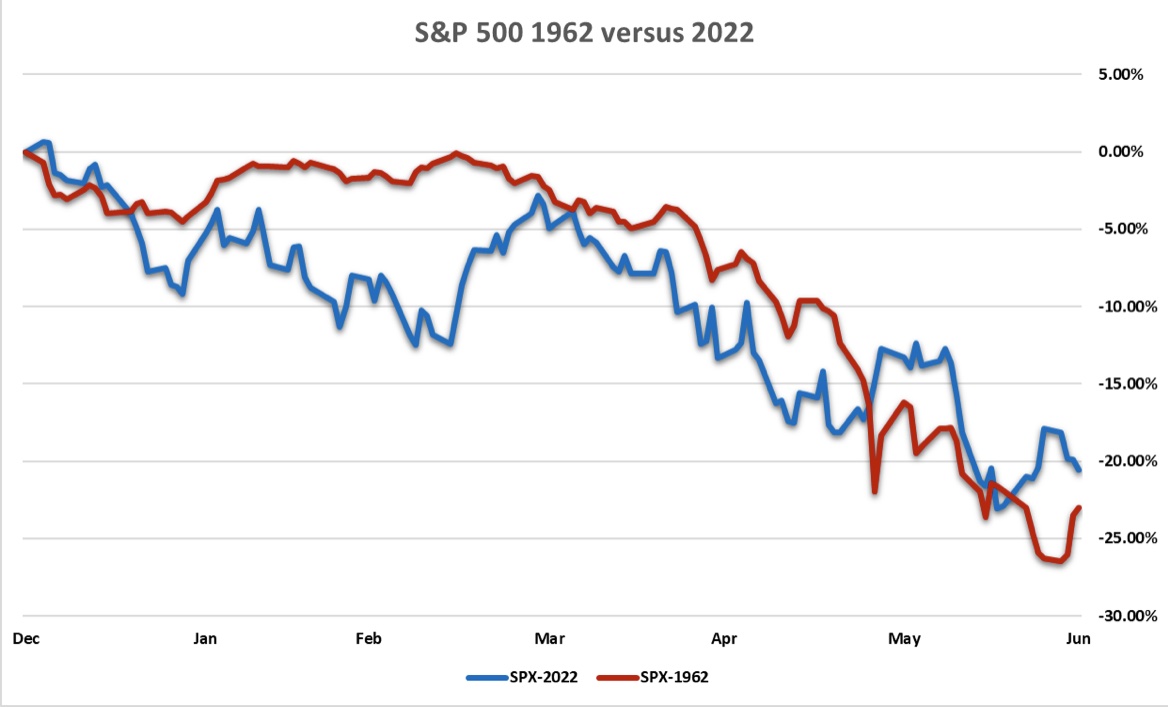
Source: Canterbury Investment Management using daily data from Yahoo Finance.
The volatility of the index during both timeframes is not shown in the chart above, but both timeframes started out with volatilities below CVI 75 and ended at CVI 140.
The first six months 1962 and 2022 started out very similar. Now, what will be most interesting to see, is how 2022 finishes. For 1962, the low in June ended up being the low point for the market. It remains to be seen whether the market has seen a low in 2022.
Source: Optuma Technical Analysis Software
It’s About Emotions, not Events
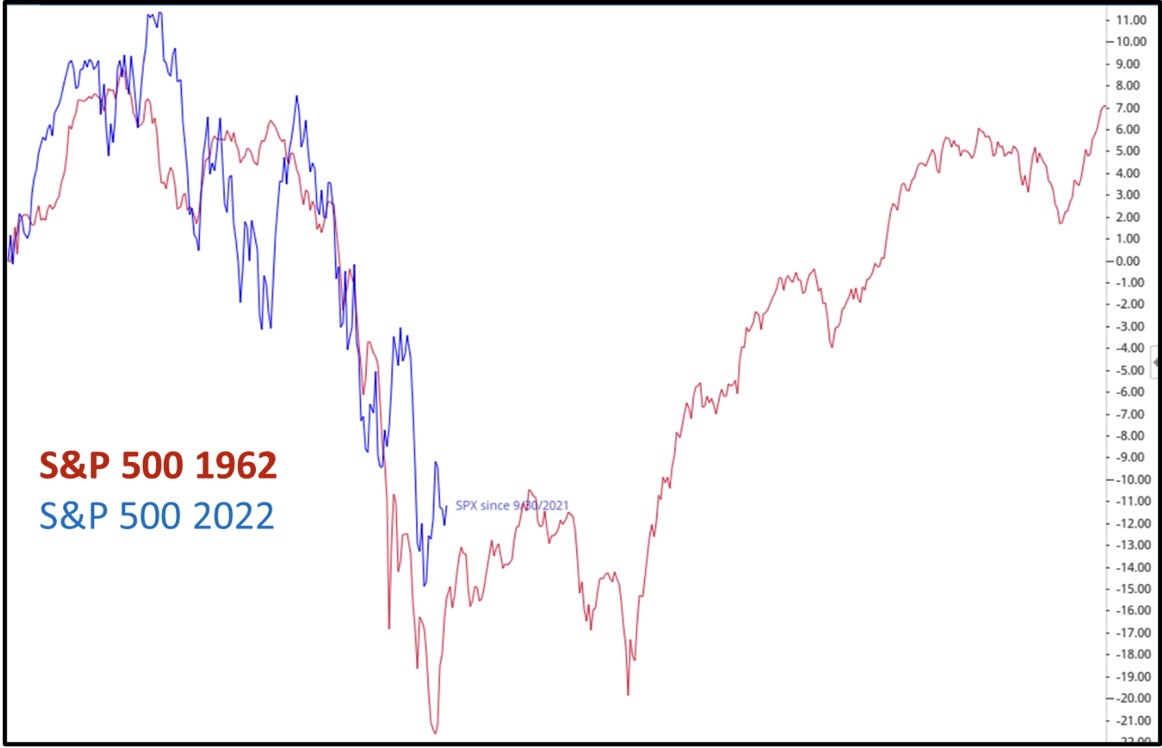
The chart above depicts two very similar market environments for the first six months of a calendar year. When comparing 1962 to 2022, I think it is safe to say that the times were very different. Inflation was at a different point, interest rates were different, and while the world events still involved the Russians, it was under very different circumstances. The question is why do these markets look very similar given the contrast in the world news?
The reason that while no two events that surround markets are the same, but the market’s actions can rhyme is because markets are driven by supply and demand, or investor behavior. So, while the events surrounding the two markets may be different, the feelings of investors are the same. That is why in a bear market, the smallest bit of news, such as speculation on what the Fed will do next, can have a large impact.
On the other hand, in a bull market, the news and world events do not play the same role on the market’s movement, even if the news event is much more impactful to the world’s economy. Following the bear market that took place in 1962, the S&P 500 rallied to new highs in 1963 and returned to a low volatility bull market. President John F. Kennedy was shot in November of 1963. The impact of that news event was a single-day -3% drop and a return to a new high within 3 days. The market proceeded forward in a bull market as if nothing happened.
What Happens Next?
Right now, the equity and bond markets are still experiencing the bearish series of lower lows and lower highs. Each time that the market has rallied, it has fallen shy of its previous short-term peak and fallen to a lower low. In order to return to a bull market, volatility needs to fall, and the market needs to put in some higher peaks and fill in some of the gaps that have occurred throughout this decline.
June 1962 ended up being a bottom in the market before returning to a new high. First and foremost, we are not saying that today’s market will continue to rhyme with 1962. The 1962 comparison does however, give us a good example of what a return to a bull market might look like. The market did not go straight from its low in June back to a normal environment. It rallied, and then pulled back to put in a higher low in October. Investor emotions remained high and pessimistic. As a matter of fact, the second low point in the chart occurred in October of 1962 during the Cuban Missile Crisis. From there, the index rallied, but volatility began to decline as the market put in higher short-term highs and higher lows.
Bear markets are full of surprises. We can not predict how the markets will behave during the next six months. What we do know is that markets will tend to do the opposite of what the masses expect. When the masses become overly pessimistic and bearish, the markets rally. Some of those rallies may be short lived and eventually pull back to low lows. Others, and what we would hope for, will put in a higher point than the previous high and have pull backs above the prior lows.
Bottom Line
Right now, the equity and bond markets are still experiencing the bearish series of lower lows and lower highs. Each time that the market has rallied, it has fallen shy of its previous short-term peak and fallen to a lower low. In order to return to a bull market, volatility needs to fall, and the market needs to put in some higher peaks and fill in some of the gaps that have occurred throughout this decline.
We are not saying that we expect the market to do exactly what it did in 1962. Again, market don’t usually repeat themselves to an exact science. Right now, we know that volatility is high, and we are in a bear market. The purpose of this update was to point out a similar market drop to the one we just experienced, and to highlight how markets fluctuate in relation to world events. In summary:
- The markets experienced the 3rd worst first 6 months to the year since 1950.
- The markets are still seeing a series of lower lows and lower highs.
- The drop from January to June looks similar to one that occurred in 1962.
- The news economic/global circumstances in 1962 were vastly different than they are today, but the charts and volatility is almost identical. That does not mean that the markets will end the year 2022 like they did in 1962
- For the market to turn things around, we need to see declining volatility and higher highs/higher lows.
For more news, information, and strategy, visit the ETF Strategist Channel.