
By Canterbury Investment Management
Market State 1: The S&P 500, which measures large capitalization US stocks, remains in Market State 1. The S&P has been in Market State 1 for 28 trading days now. According to Canterbury studies dating back to 1950, the S&P 500 has had 259 periods of being in Market State 1. On average, coincidentally, the S&P 500 has stayed in MS 1 for 28 days before transitioning to a different Market State (most of the time to MS 2). There is a very wide variance in terms of consecutive days in Market State 1, with the longest period lasting 163 days (from 12/16/1994 – 8/9/1995).
One characteristic of Market State 1 is that the market is most likely to put in a new high. In fact, 86% of all new highs are put in during Market State 1, coming out to about 1 new high for every 7 days in Market State 1. So far, during this period in Market State 1, there have been 9 new highs. Keep in mind that most Market State 1 periods initially occur after a run up. In other words, you are less likely to find a Market State 1 when the market is closer to a bottom than a peak. Because of this, Market State 1 will most likely be in place when peaks occur and could be subject to a pullback.
Canterbury Volatility Index (CVI) – CVI 53 – The Canterbury Volatility Index (CVI) continues to be low and decreasing. While this is a bullish characteristic, we are further approaching extreme low volatility (CVI less than 45). The last time that CVI was extremely low was back in October 2018 (pictured below), prior to experiencing a series of outlier days followed by the trading anomaly in December. As volatility compresses, it may eventually need to relieve some pent-up pressure in the form of an outlier day (+/-1.5%) or two.
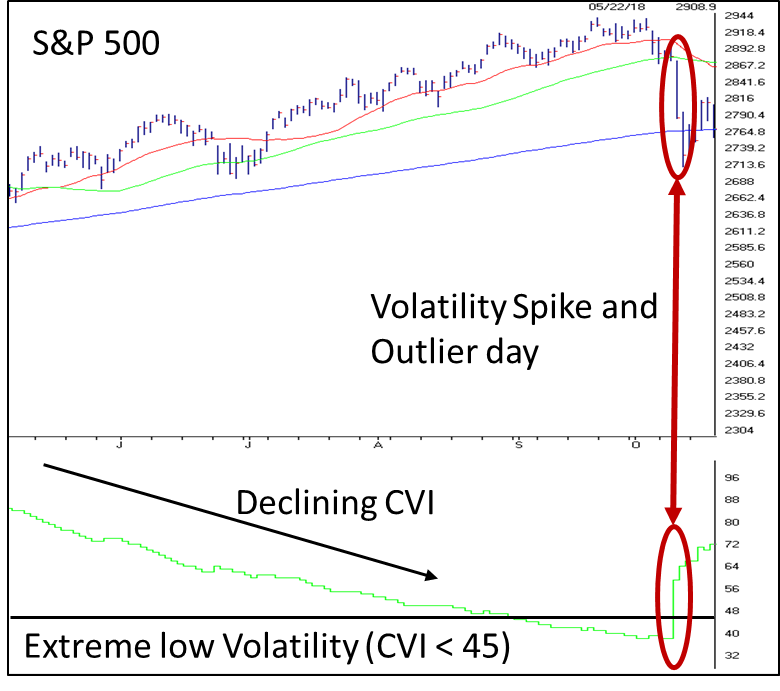
Volatility Spike and Outlier Day (October 2018) – Source: AIQ
Comment
One thing we know for sure, is that markets are not random, nor are they evenly distributed. These are some of the typical “conventional wisdoms” we see when it comes to investment management. When analyzing daily data on stock markets, we will notice that outlier days occur way more often than they should, and often back-to-back.
For example, a 3rd standard deviation day on the S&P 500, which is about +/-3%, should occur once every 1.5 years according to bell curve math. In reality, a +/-3% day occurs once every 6 months. A 4th standard deviation day, which again according to bell curve math should only occur once every 62 years, has actually occurred once every 1.18 years. Market outliers occur far more often than a random distribution would suggest.
These outliers do not come in even distribution either. We would not expect to see a 3% day and then have to wait another 6 months before seeing another 3% day. Market outliers will typically occur in clumps. These outlier days come after spikes in volatility. Canterbury developed the concept of Market States and Security States not to be predictive of an index or security’s return, but rather an indication of risk.
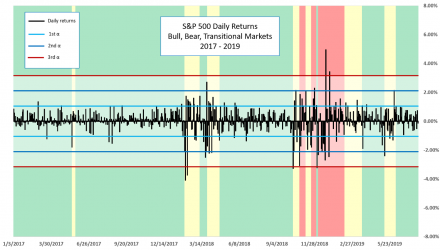
The chart below shows the daily returns for the S&P 500 from 2017-present. It also shows the Market Environment (Bullish is Green; Transitional is Yellow; Bearish is Red). During Bullish periods, you will notice that the daily returns are typically within a first standard deviation (+/-1%), with a few just outside, but still within a second standard deviation (< 2% up or down).
During Transitional and Bearish environments, we can see there are lot more outlier days, exceeding a second, third, or even a fourth standard deviation. These periods exhibit higher volatility. Following the trading anomaly in December (highlighted by the red/yellow period), the market began to show declining volatility, with a short Transitional period in the month of May that had some days beyond a 2nd standard deviation (+/-2%). You can see that following the trading anomaly (when the market environment is Bullish), daily returns are more stable.
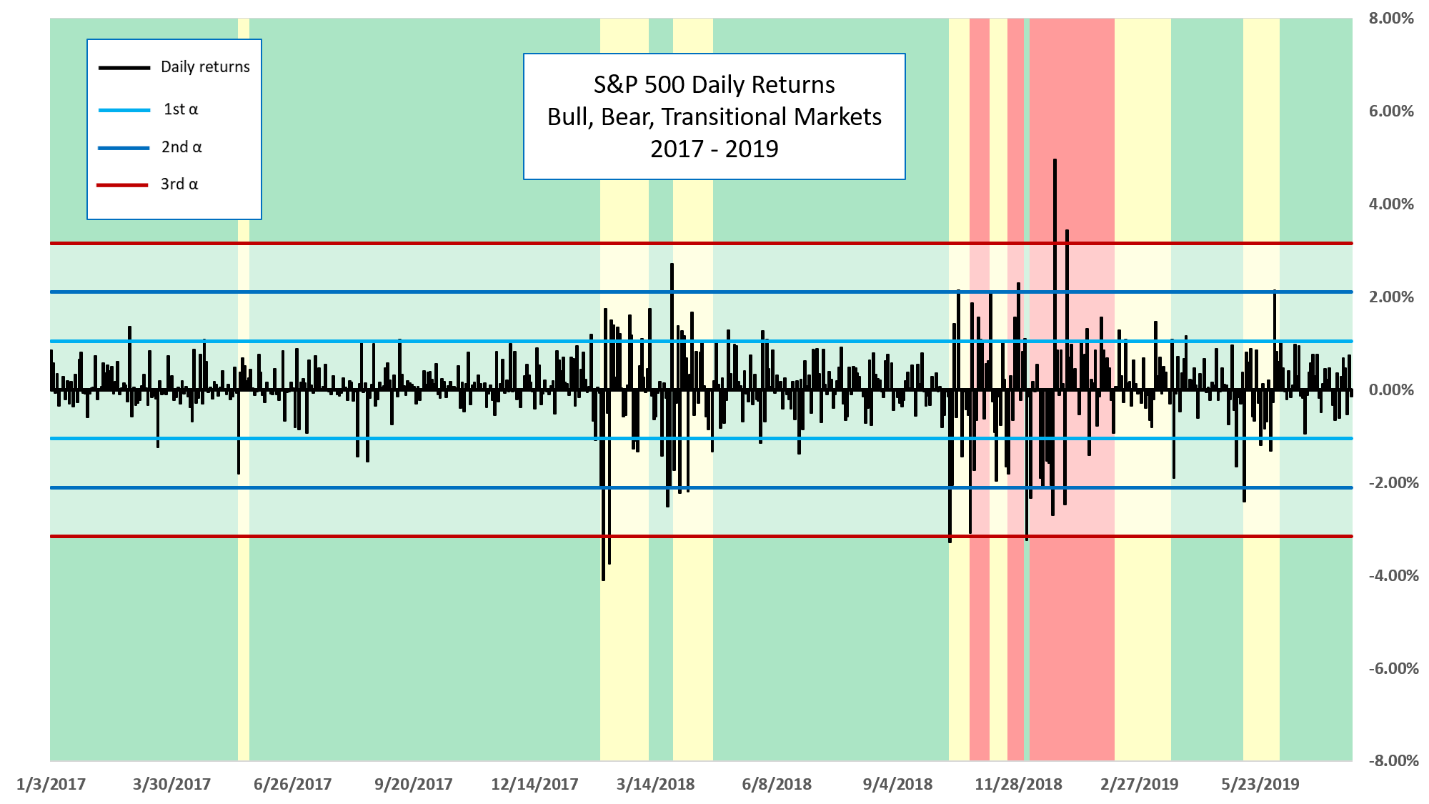
Source: Canterbury Analytics Group
This chart shows that Market States are a predictor risk, or when to expect the unexpected (outlier days). Each and every asset class will have both bull (low risk) and bear (high risk) markets: periods where outlier days are more likely or less likely.
Style Rankings
According to Canterbury’s risk adjusted rankings (Volatility-Weighted-Relative-Strength), here are the current rankings for the style indices. You can see the Large Caps continue to show strength over other styles.
| Style | VWRS RANK |
| Large Cap Growth | 1 |
| Large Cap Value | 2 |
| Mid Cap Growth | 3 |
| Mid Cap Value | 4 |
| Small Cap Growth | 5 |
| EAFE | 6 |
| Small Cap Value | 7 |
| Emerging Markets | 8 |
Bottom Line
The S&P 500 remains at a peak and volatility continues to decrease. This may lead to an outlier day, as the market may decide to relieve some pent-up pressure from compressed volatility. Furthermore, Large Caps continue to lead throughout this recent rally.
We know that all securities and asset classes, based on supply and demand will have both bull and bear periods. Canterbury’s Market States are a good indication of risk. We take this one step further and apply this concept to all liquid traded securities and can choose a combination of these securities that create an efficient, bullish portfolio- one capable of limiting risk and compounding returns.
The Canterbury Portfolio Thermostat relies on a different set of assumptions. Markets are not random and normally distributed and portfolio decisions should not be based on subjective view of investor’s risk tolerance and personal objectives, but instead decisions should be made based on creating the most efficient portfolio that matches the existing market environment. The Portfolio’s allocation, diversification, security selection, and construction should adapt to move in concert with the dynamic market environments- bull or bear.
This article was submitted by Canterbury Investment Management, a participant in the ETF Strategist Channel.