

By Gary Stringer, Kim Escue and Chad Keller, Stringer Asset Management
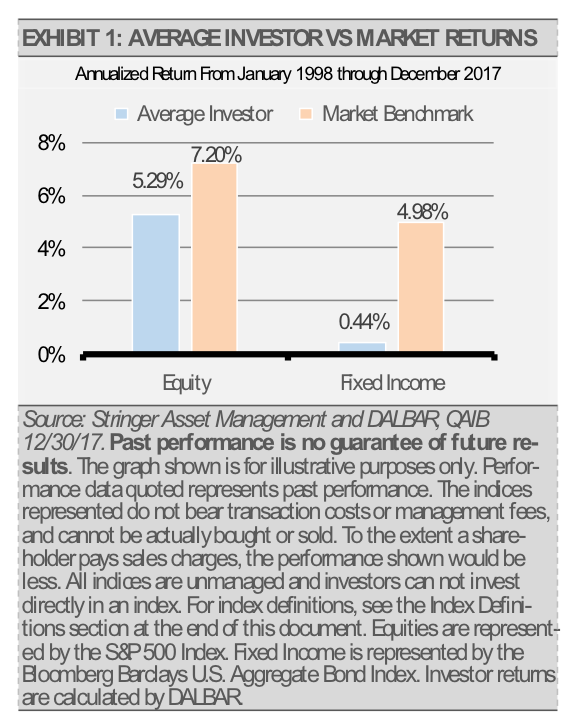
We believe the greatest challenge facing investors when navigating financial markets is behavioral. The old credo of ‘buy low, sell high’ is easier said than done as evidenced by the annual Dalbar study which highlights the gap between benchmark and investor returns.
Behavioral economics teaches us that investors feel the pain of a loss roughly twice as much as the euphoria of gain. This divergence can lead to emotional decisions that could potentially derail a sound financial plan.
Intuitively, investors know that during periods when markets are down and valuations are cheap, the opportunity is often the highest. These times usually end up being the best time to buy and the worst time to sell. Conversely, when equity markets are reaching new highs and valuations are expensive, it simply feels much better to invest in a rallying bull market.
Having the data on market corrections can go a long way in providing some perspective during volatile times by focusing on the number and depth of historical drawdowns and the timing of subsequent recovery. In addition, having the proper asset allocation before a market drawdown can be the most valuable tool in planning and weathering difficult markets. Investors can and should use proper asset allocation to ensure that the range of returns of their portfolio is within a band that limits the potential downside and provides sufficient upside to meet their long-term investment goals.
Understanding historical volatility is a good place to start the process. Behavioral economics teaches us that we adapt to our environment by projecting the current environment into the future. For instance, periods of high and/or low volatility can give investors a false sense of what is typical and lead to flawed assumptions about what the volatility regime may look like in the future. Investors might project today’s relatively high volatility into the future and assume that the markets will continue to behave this way. Within the context of historical market environments, today’s volatility may be a return to normalcy after a particularly quiet 2017 (exhibit 2).

Providing a perspective on the frequency, depth and duration of market drawdowns is as important as understanding a targeted rate of return. After all, it’s much more important to have a plan in case of emergency than it is to have a plan in case of utopia. Great planners plan for base-case, best-case and worst-case scenarios. As the following table suggests, even asset allocated portfolios can experience significant drawdowns (exhibit 3). We think it is crucial to have a frame of reference to help understand what can be expected in terms of the historical magnitude of drawdowns and the time to recovery. There is a large distinction between the types of drawdowns, be they a pullback, a correction, or a bear market.
Thinking about risk in terms of standard deviation and beta is helpful when constructing portfolios, but we prefer to use drawdown when looking at risk tolerance from an investor perspective to assist in determining the appropriate asset allocation. More specifically, having a sense of the worst-case, frequency, size, timing and average days to recovery of various allocations may provide some perspective in selecting a portfolio an investor can live with through difficult market conditions.
