

By Yuling “Ivey” Zhang
Summary
- While many investors have adopted a multi-factor approach to style investing, some have pushed these boundaries by advocating for an active, rotational approach to factor allocation.
- In a recent white paper, MSCI suggests several methods that might be conducive for performing style rotation, including macro-, momentum-, and value-based signals.
- In this commentary, we attempt to test the macro- and momentum-based approaches on (slightly) out-of-sample data.
- We find that both approaches have historically out-performed a naïve, equal-weight factor portfolio. However, the results for the macro-based approach are so good, they raise questions about hindsight bias. Momentum results, on the other hand, are far less compelling on U.S. equity factors than the World equity factors tested by MSCI.
- After appropriately discounting for fees, taxes, and other costs, as well as adequately discounting for testing biases, these methods may not offer much benefit over naïve, equal-weight approach.
While the empirical evidence suggests that factor investing has historically generated an excess (risk-adjusted) return premium over the long-run, short-term performance can be volatile. Because of this, an increasing number of investors are adopting a diversified approach to factor investing, holding multiple factors at once.
Although even simple allocation models – such as naïve equal-weight – have historically harvested these diversification benefits, some researchers believe that dynamic factor allocation can further enhance the returns.
One argument for taking a dynamic approach is that the performance variability is cyclical and linked to different stages of the economic cycle. The different underlying economic drivers lead to differentiated active returns and therefore lead to potential opportunities for cross-factor rotation.
For example, in a recent white paper, MSCI provides several dynamic models in what they call “Adaptive Multi-Factor Allocation.”
In this commentary, we replicate two variations of the MSCI’s Adaptive Multi-Factor models: the macro-cycle-based and momentum-based allocation methodologies. While the MSCI’s methodology is tested on world equity data, we employ US equity data as a (slightly) out-of-sample test. In line with MSCI’s research, six long-only US factors – Value, Size, Low Volatility, High Yield, Quality, and Momentum – were selected as our investible universe.
Macro Cycle-Based Allocation
Many research studies suggest that macro indicators have a strong explanatory power to systematic factor returns. One hypothesis is that the excess returns of factors could be compensation for bearing different forms of macroeconomic risk.
Historical performance of factor investing seems to prove this argument as the returns have been cyclical under different stages of the business cycle. For example, value and size factors tend to be most affected by negative economic growth (providing a risk-based argument for their long-term premium), while quality and low volatility are usually the most defensive factors due to their structurally lower equity betas. Therefore, it might make sense to invest in defensive factors during the periods of economic slowdown. On the contrary, cyclical factors could add more value during expansionary phases.
Following MSCI’s methodology, economic cycles are classified into four primary states: Expansion, Slowdown, Contraction and Recovery. Each state is defined based upon the level and slope of a 3-month moving average (“MA”) minus a 12-month MA. In this commentary, we will employ three macroeconomic indicators (which are the best 3 performing macro indicators in the MSCI’s model):
- PMI (United States ISM Purchasing Managers Index)
- CFNAI (Chicago Fed National Activity Index)
- ADS (Aruoba-Diebold-Scotti Business Conditions Index)
If the 3-month MA is above the 12-month MA and the spread between the two is increasing, the economic state is labeled as an Expansion. If the spread is decreasing, however, the economic state is labeled as a Slowdown. On the other hand, if the 3-month MA is below the 12-month MA and the spread is declining, the state is Contraction. If the spread is negative but increasing, then the economy is in a Recovery
Exhibit 1: Economic Cycles of ISM PMI Index

Source: Quandl PMI Composite Index. Calculations by Newfound Research. Results are hypothetical and should not be used for investment purpose.
An equal-weight portfolio comprising of 3 of the 6 factors is constructed for each state. According to the MSCI paper, the 3 factors for each stage are predetermined based on their historical performance and the past studies on each factor. While we have described our skepticism of these choices in our previous commentary on Style Surfing the Business Cycle, we will assume that the intuition on these factor mixes is correct.
The given combinations are as follows:
- Expansion: Momentum, Size, Value
- Slowdown: Momentum, Quality, Low Volatility
- Contraction: Low Volatility, Quality, Value
- Recovery: Size, Value, High Yield
With the business cycle signals from the moving average cross-overs and the regime-based factor baskets, we can implement the dynamic factor strategies. We construct a portfolio for each indicator, rebalancing monthly based upon the identified economic regime. We also construct an blended portfolio by combining these three sub-portfolios together in hopes of benefiting from signal diversification.
Below we plot the relative returns for each portfolio against the MSCI USA Index and compare them to the equal-weighted portfolio across all 6 factors.
Exhibit 2: Relative Performance of Macro-Cycle Timing Portfolios vs. MSCI USA Index

Source: MSCI USA Standard Universe. Calculations by Newfound Research. Returns are hypothetical and are not intended to be interpreted as recommendation to any portfolio construction. Returns assume the reinvestment of all distributions. Results are gross of all fees, including, but not limited to, manager fees, transaction costs, and taxes. Past performance is not an indicator of future results. You cannot invest in an index. Sample Period is November 1997 – August 2019.
As we can observe from Exhibit 2, the blended portfolio (and each individual strategy) has meaningfully outperformed both a market-cap weighted benchmark as well as an equal-weight portfolio of the six underlying factors over the past 20+ years. It seems like the macro-cycle-based factor allocation provides a promising return.
Why is that? One potential reason is that factor returns are linked to the economic cycle and that using monthly (or even daily) updated macro indicators can provide timely insights into the economic state. These higher-frequency signals allow us to potentially capture smaller business cycle fluctuations that are not announced by the NBER (National Bureau of Economic Research) or other institutions. The 3-month vs. 12-month moving average may also help filter undesired noise from the process.
Another potential reason is that the factors were well selected for each identified economic state. However, as we highlighted in our previous commentary, we know the factor allocations for each state were largely determined by the historical performances of each factor during that period of the business cycle.
This raises an important question: is the result a byproduct of data mining or the materialization of an unintentional hindsight bias?
To explore this question, we will perform a random sampling test. Specifically, we will look at the results of alternative portfolio choices we could have made. With four economic states and 3 (out of 6) factors selected for each, there are 160,000 possible economic state / factor portfolio configurations. Below we plot the annualized return distribution of these different configurations and highlight where the MSCI selection falls:
Exhibit 3: Distribution of Random Sampling Test
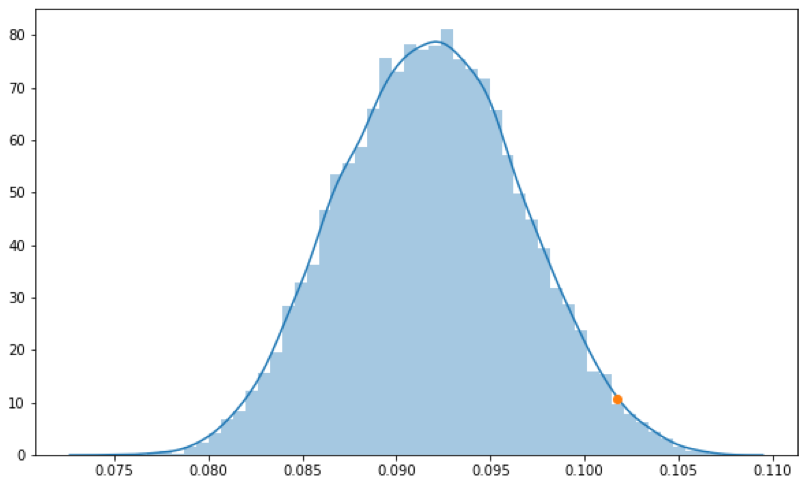
Source: MSCI USA Standard Universe. Calculations by Newfound Research. Returns assume the reinvestment of all distributions. Results are gross of all fees, including, but not limited to, manager fees, transaction costs, and taxes. Past performance is not an indicator of future results. You cannot invest in an index.
Among all the possible combinations, the portfolio defined by MSCI’s factor choices lies at the 98th percentile on the annualized return distribution curve. While we would certainly want the choice to perform better than a random selection, such strong performance might suggest the choice was impacted by the benefit of hindsight.
However, it is interesting to note that in the MSCI’s definition, value is held in three states of the business cycle (contraction, recovery, and expansion) while the value factor in MSCI’s construction, either intuitionally or historically, may not actually be the most appropriate factor for all three periods. For example, during periods of expansion, some argue that market tends to favor companies with high growth potential instead of firms with low intrinsic value.
Below we plot the annualized returns for reach factor during each macro-economic state (as defined by the CFNAI indicator).
Exhibit 4: Annualized Returns for Each Factor During Each Macro State

Source: MSCI USA Standard Universe. Calculations by Newfound Research. Returns assume the reinvestment of all distributions. Results are gross of all fees, including, but not limited to, manager fees, transaction costs, and taxes. Past performance is not an indicator of future results. You cannot invest in an index.
Of the 12 possible factor choices to match up with the fully data-mined allocations, MSCI aligns with 9. Still, we cannot assert that the MSCI’s predefined rotation rule is a byproduct of pure data mining. It could be a mix of data mining and prevalent beliefs (e.g. the defensive nature of value prior to the 2008 crisis). We should also remember that we are testing U.S. equity factors while the original MSCI research was performed on world equity data, which might lead to subtly different factor choices.
We should also be careful to consider how market unpredictability might negatively skew the returns. As there is no set reason for how or why a financial crisis might unfold, the reliability of using predetermined definitions based solely upon past history may be questionable for future performance.
Exhibit 5: Monthly Return Distribution of MSCI US Value Factor in Contraction, Recovery, and Expansion Phases
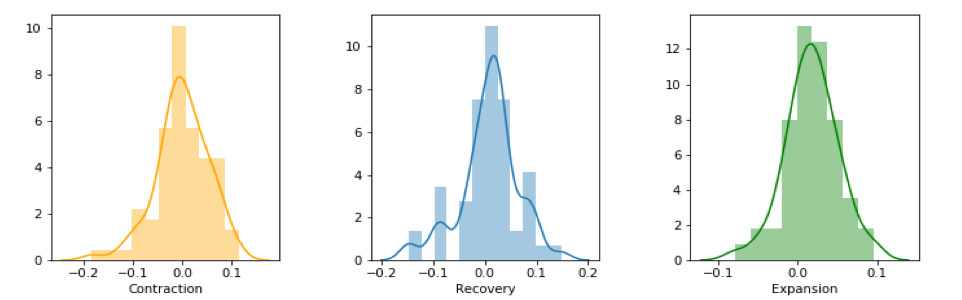
Source: MSCI USA Standard Universe. Calculations by Newfound Research. Returns assume the reinvestment of all distributions. Results are gross of all fees, including, but not limited to, manager fees, transaction costs, and taxes. Past performance is not an indicator of future results. You cannot invest in an index. Sample Period is November 1997 – August 2019.
Momentum-Based Allocation
MSCI also tests a dynamic factor construction based upon momentum signals. This approach is also not without academic basis. For example, Research Affiliates performed a study on the momentum effect amongst 51 factors and found that factors exhibit stronger momentum than both individual stocks and industries. They found that momentum is a prevailing property of almost all factors.
To test the viability of momentum-based allocation, we follow MSCI’s methodology and rank the factors based upon their prior returns, rebalancing monthly and holding the top 3 ranked factors. The ranking is calculated based upon the last 1-month, 6-month, and 12-month total returns for each factor.
Click here to read the full article on Newfound Research.