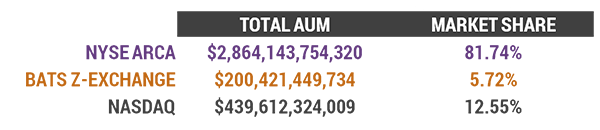
The ETF industry is more than just issuers like WisdomTree (WETF) and Invesco (IVZ); it includes: index and data companies, operational service providers, liquidity traders, and exchanges. Each week, we note the listing market share of the three primary US ETF exchanges and some people may take the importance of frictionless liquidity for granted.
![]()
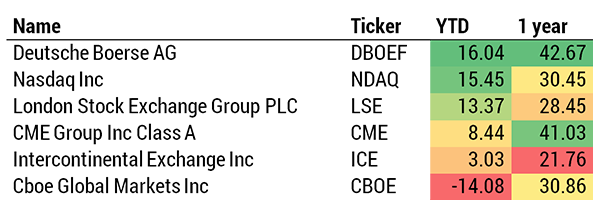
However, with exchanges currently representing 17% of TETF.index, the six exchanges that are tracked have performed quite well, and a deeper dive is warranted. After all, what is often lost about high volatility is the fact that the exchanges, as the liquidity provider, are the beneficiary of increased trading activity.
Diving deeper into the various categories of ETFs, it is no surprise that NYSE has the lion’s share of the volume at about 85% of the overall trading volume, but many might be surprised to learn that NASDAQ has over 32% of the fixed income AUM; almost 3 times its 12.55% asset class weighting.
Asset Class by Exchange
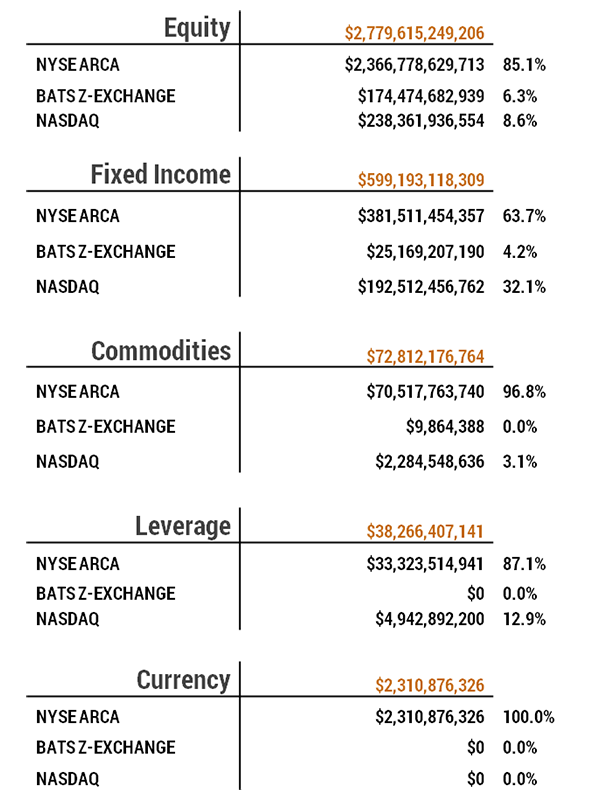
Another standout is the NYSE dominance with 97% of Commodity ETF listings, while it appears almost none are listed on the BATS. The same pattern persists in both Leverage and Currency listing with lion’s share going to the NYSE. First mover advantage almost certainly is the reasoning for this position.
Average Trading Volume of an ETF Per Exchange
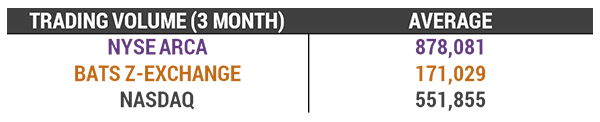
The chart above shows the average 3-month trading volume of ETFs listed on each exchange. Again, NYSE is the highest helped by big trading ETFs like SPY as well as most leveraged ETFs. Nasdaq is number 2, but with an impressive 551,855 average volume helped by QQQ. BATS is in last place probably due to the listing of many new funds from the aggressively attractive pricing.
Active ETFs by Exchange
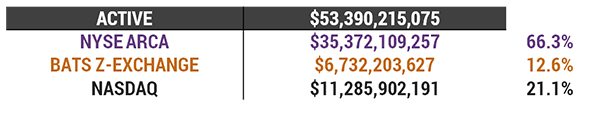
The active space surprised us further with both BATS and NASDAQ showing much higher market share than what would have been expected.
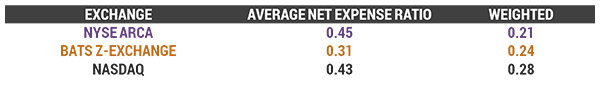
Average Expense Ratio by Exchange
![]()