

SUMMARY
Resistance prevailed. Now support is in play. Given oversold readings, how the stock and bond markets handle support and how the Fed reacts to the September 13 CPI report will be important guideposts and aid in discerning if/when the equity market retests its June-July lows.
Laboring indeed
Laboring: working or moving with difficulty. If someone (or something—equity and fixed income markets for example) is laboring, they’re working extremely hard, often in a way that makes them exhausted; to exert power with painful or strenuous effort. Yes, that pretty much sums up the domestic equity and fixed income markets’ experience year to date, including August (Figures 1 and 2) and following the mid-June price low. To this last point, following an almost 19% intraday rally by the S&P 500 (SPX) between June 16 and August 16, the SPX has since fallen almost 10% from its 8/16/22 intraday high to its 9/1/22 intraday low. This is another example of equity market volatility we have been expecting since late 2021.
Figure 1: 60-40 Portfolio Returns. To paraphrase a very bright friend, “If Wall Street was driven by active money management, not passive, things would be much worse in 2022.” When looking at the 60/40 equity to fixed income portfolio allocation statistics from Bespoke Investment Group, I agree with him.
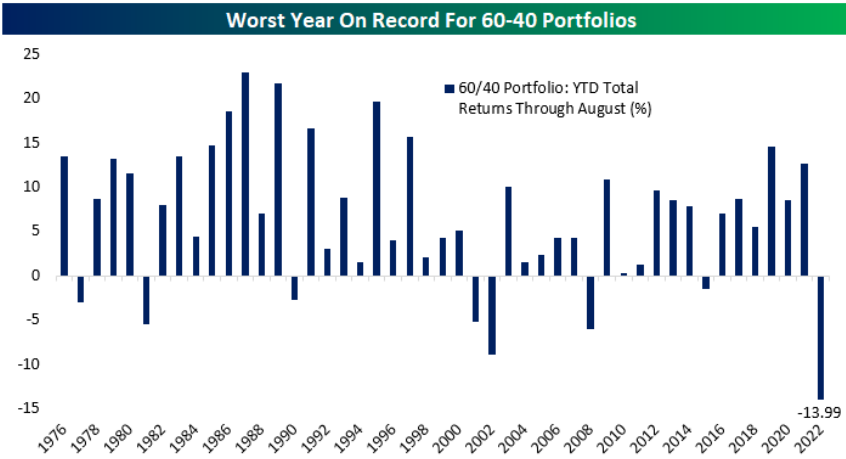
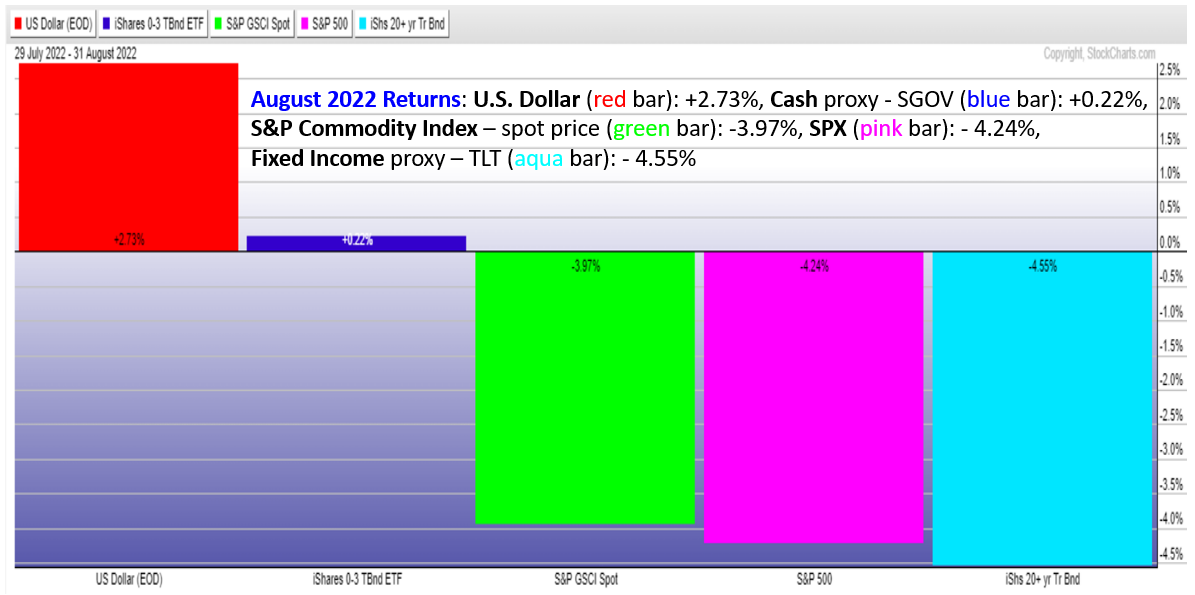
Figure 2: August 2022 Returns. | What effect will the statistics shown in Figure 1 and below and the volatility experienced by the equity and fixed income markets this year have on investor expectations for the 4th quarter and beyond—2023?
Note: Speaking to “expectations” and volatility, I don’t think there will be a let-up in volatility until at least the mid-term elections in early November. On an even shorter-term basis, within a historically weak seasonal period and a declining 200-day MA, besides the September 13 CPI report, due to algo positioning I think the odds favor volatility continuing in both directions prior to and coming out of quarterly options expiration—September 16. Also of note, the next FOMC meeting is September 21.
From Resistance to Support and Now…
Friday intraday swing of almost 845 points (from high to low) by the DJIA, and similar intraday swings by other equity proxies, locked in another layer of short-term overhanging selling pressure (resistance). SPX shown in Figure 3.
Figure 3: S&P 500 Index. | A meaningful break of support in and around 3900 would suggest lower prices, as depicted in the chart.
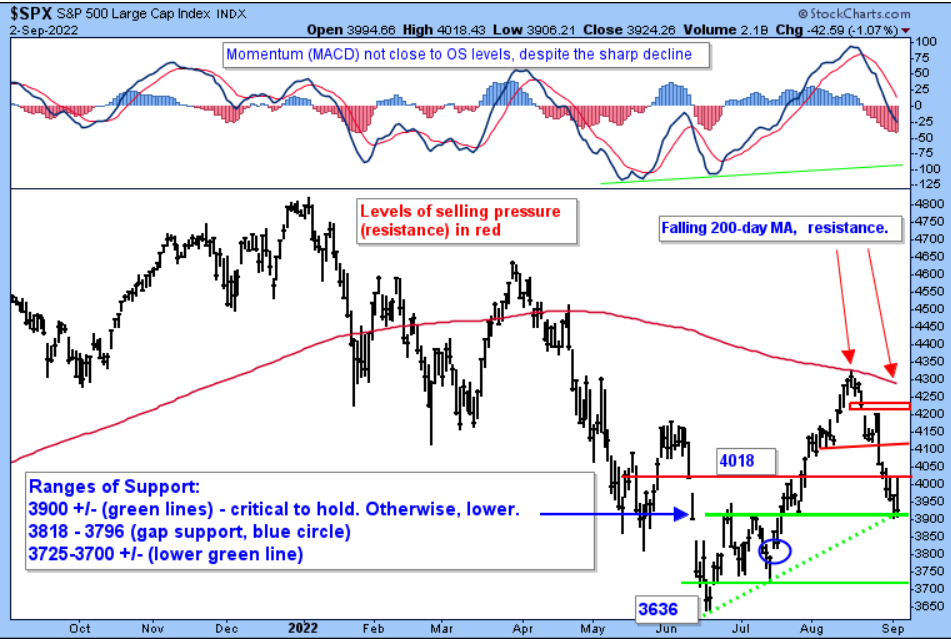
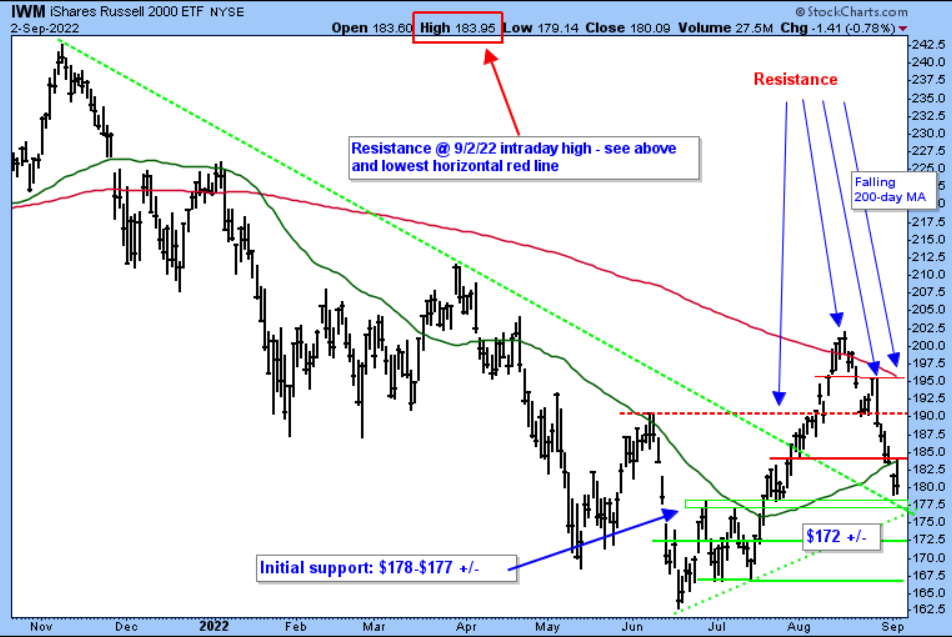
Figure 4: iShares Russell 2000 ETF. | Small Caps play an important role in many internal breadth readings and are also an intriguing second derivative proxy for credit spreads and economic conditions. Please refer to, and respect how, IWM responds to the support and resistance levels shown inside the chart.
Against the Trend (and consensus)
We are a big believer in managing downside risk and following trends—simple and straightforward, don’t fight the trend.
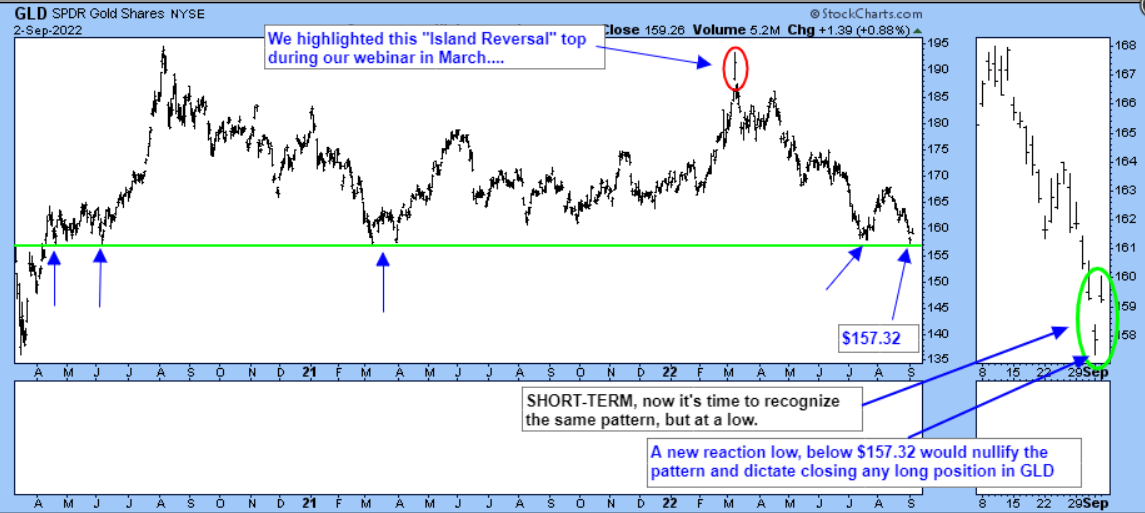
Figure 5: SPDR Gold Shares. | We recognize, however, not everyone follows this school of thought, preferring to trade that which is “down and out.” If so, and in light of a deeply oversold near-term equity market condition, as defined by the McClellan Oscillator (please reach out for a chart), please review the chart below. A new reaction low below $157.32 would nullify the pattern and suggest selling a long position in GLD.
Day Hagan Asset Management appreciates being part of your business, either through our research efforts or investment strategies. Please let us know how we can further support you.
Art Huprich, CMT®
Chief Market Technician
Day Hagan Asset Management
—Written 09.05.2022. Chart source: Stockcharts.com unless otherwise noted.
UPCOMING EVENTS
Day Hagan Technical Analysis with Art Huprich, CMT, September 20, 2022, at 4:15 p.m. EDT
Disclosure: The data and analysis contained herein are provided “as is” and without warranty of any kind, either express or implied. Day Hagan Asset Management (DHAM), any of its affiliates or employees, or any third-party data provider, shall not have any liability for any loss sustained by anyone who has relied on the information contained in any Day Hagan Asset Management literature or marketing materials. All opinions expressed herein are subject to change without notice, and you should always obtain current information and perform due diligence before investing. DHAM accounts that DHAM, or its affiliated companies manage, or their respective shareholders, directors, officers and/or employees, may have long or short positions in the securities discussed herein and may purchase or sell such securities without notice. The securities mentioned in this document may not be eligible for sale in some states or countries, nor be suitable for all types of investors; their value and income they produce may fluctuate and/or be adversely affected by exchange rates, interest rates or other factors.
Investment advisory services offered through Donald L. Hagan, LLC, a SEC registered investment advisory firm. Accounts held at Raymond James and Associates, Inc. (member NYSE, SIPC) and Charles Schwab & Co., Inc. (member FINRA, SIPC). Day Hagan Asset Management is a dba of Donald L. Hagan, LLC.