After years of strong returns, especially relative to long-term averages, the equity market seems to be taking steps back, as it normally does after a period of above average performance. Volatility is the price that investors pay for strong long-term results.
Our work suggests that the financial markets are not pricing in a U.S. recession at this time. We think the markets are going through a valuation reassessment based on persistent inflation and higher interest rates.
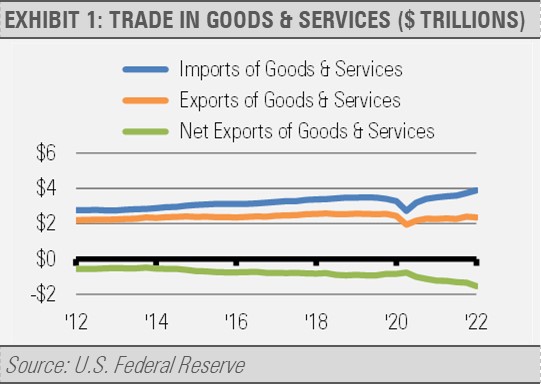
While first quarter 2022 U.S. gross domestic product (GDP) was down, GDP is a very broad measure and includes components that do not necessarily reflect the trajectory of domestic businesses and the economic strength of U.S. households. For example, imports reduce GDP whereas exports increase GDP.
The recent easing of supply chain bottlenecks, such as those we experienced at the ports of Los Angeles and Long Beach, helped contribute to a jump in imports and lessened GDP.
As exhibit 1 suggests, exports have been relatively stable since the recovery took hold while the growth in imports has been strong due to substantial domestic demand. The strength in domestic demand for imports relative to the global demand for U.S. exports is a net negative to U.S. GDP and may obscure the actual strength of our economy.
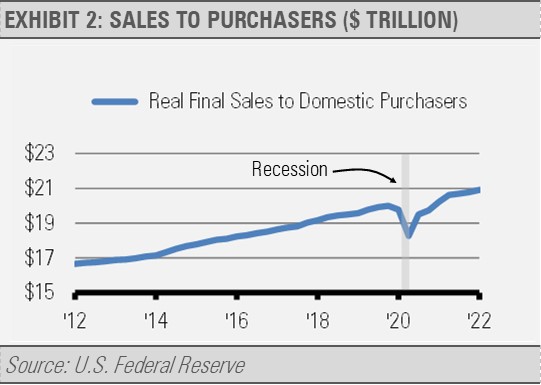
By stripping away some of the GDP components, we can focus on the real final sales to domestic purchasers and see that domestic demand remains strong. In fact, real final sales to domestic purchasers increased from an annualized growth rate of 2.6% late last year to 3.7% in the first quarter. Importantly, real final sales to domestic purchases typically falls on the cusp of a recession, but that is not what we see in the current data (exhibit 2). We view this trend as a sign of strength for the U.S. economy.
Inflation will likely continue well above the 2% average target of the U.S. Federal Reserve (Fed) for the next couple of years as we navigate this environment with a resilient economy and a Fed that remains behind the curve. It will take time for the U.S. economy to absorb the nearly $5 trillion in excess liquidity and strong demand that is the primary cause of inflation in our view.
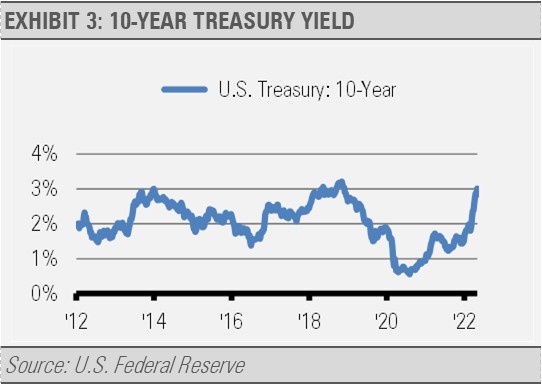
Though we think that we have experienced the majority of the move higher in long-term interest rates, rates across the yield curve still have some room to increase. The 10-year Treasury yield made a huge move going from the low of 0.52% in August 2020 to over 3.00% recently. We do not expect to see long-term interest rates move significantly higher, but we do think that another increase of 0.50% or so is possible. That move would put the 10-Year Treasury yielding about 3.50%, but we think that long-term rates will settle in closer to 3.00% in the coming years if inflation eases back to around 3.00% and real GDP settles in near its approximately 2.00% potential annual growth rate.
INVESTMENT IMPLICATIONS
Equity market valuations may struggle in the near-term, but persistent economic growth provides a solid backdrop for increased revenue and earnings growth over time. The recent decline in stock market prices simply increases our expectations for medium-term and longer-term returns from this point. We have used market weakness to increase existing positions in health care and financials as well as to add exposure to small cap value.
Our view on foreign economies and equity markets is less cheerful and we have built up our cash position to some degree. Still, we are finding interesting opportunities globally and expect to find compelling opportunities to deploy that cash going forward.
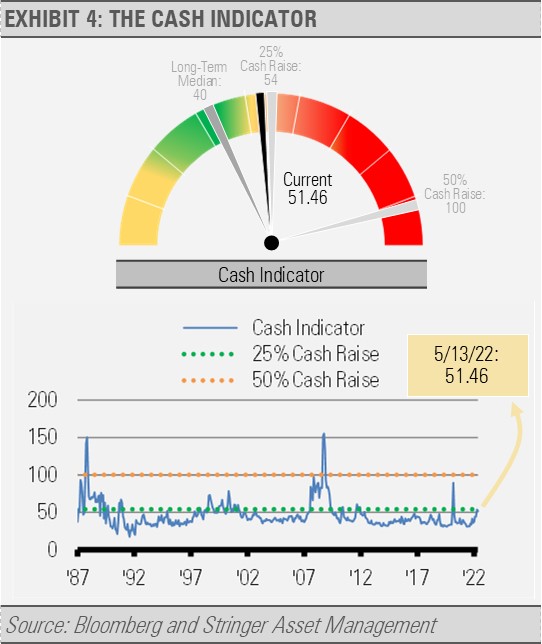
THE CASH INDICATOR
The Cash Indicator (CI) is useful for helping us judge potential volatility, which includes the current market stress. The environment is evolving, and we expect the volatility to normalize in time. While the CI is elevated, it does not suggest that the recent market pressure is related to a systematic breakdown. These findings are also consistent with our fundamental work that indicates this is a market correction that is nearing its end and should not turn into a prolonged crisis, at least not in the U.S.
DISCLOSURES
Any forecasts, figures, opinions or investment techniques and strategies explained are Stringer Asset Management, LLC’s as of the date of publication. They are considered to be accurate at the time of writing, but no warranty of accuracy is given and no liability in respect to error or omission is accepted. They are subject to change without reference or notification. The views contained herein are not be taken as an advice or a recommendation to buy or sell any investment and the material should not be relied upon as containing sufficient information to support an investment decision. It should be noted that the value of investments and the income from them may fluctuate in accordance with market conditions and taxation agreements and investors may not get back the full amount invested.
Past performance and yield may not be a reliable guide to future performance. Current performance may be higher or lower than the performance quoted.
The securities identified and described may not represent all of the securities purchased, sold or recommended for client accounts. The reader should not assume that an investment in the securities identified was or will be profitable.
Data is provided by various sources and prepared by Stringer Asset Management, LLC and has not been verified or audited by an independent accountant.