

By Gary Stringer, Kim Escue and Chad Keller, Stringer Asset Management
With a broad collection of economic signals ranging from business surveys to interest rates stabilizing in recent months, the pace of economic growth and the financial markets may be approaching an equilibrium where the pace of growth and long-term interest rates hold steady.
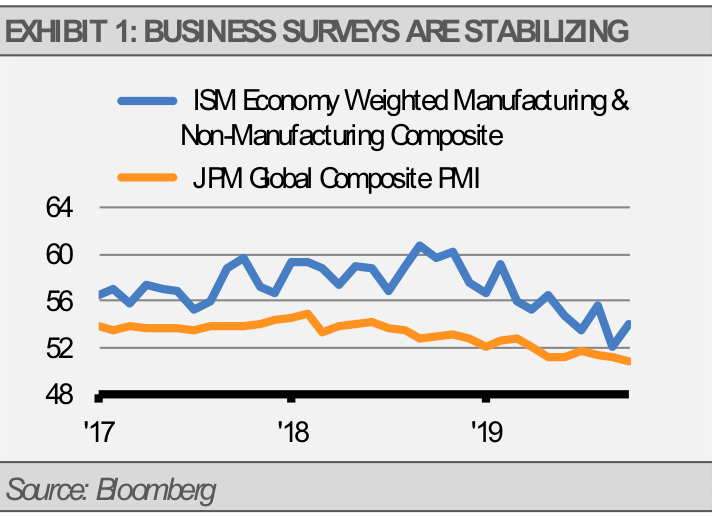
For example, U.S. and global composite PMIs have shown signs of stabilization over the last few months. This stability suggests that the slowdown in the pace of economic growth has bottomed.
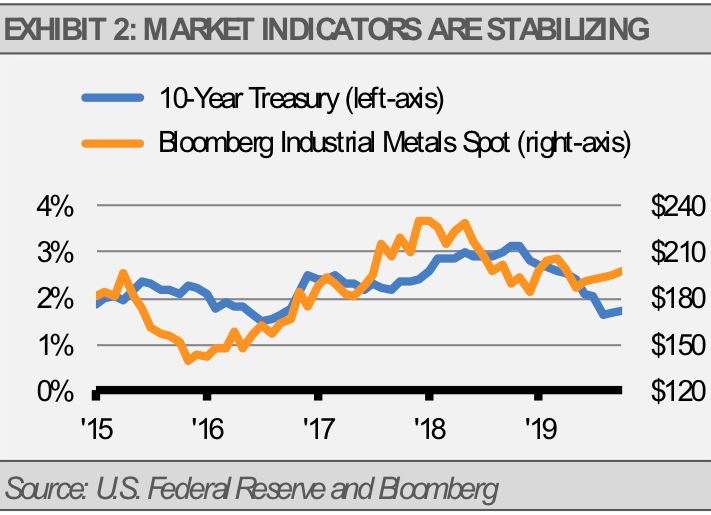
Furthermore, while long-term interest rates and industrial commodity prices have recovered from recent lows, they remain well below levels seen before the pace of growth began to slow in 2018.
We are not expecting a significant recovery in the pace of growth. Rather, we think that 1.8% annualized real GDP and 3.5% annualized nominal GDP will be the norm going forward.
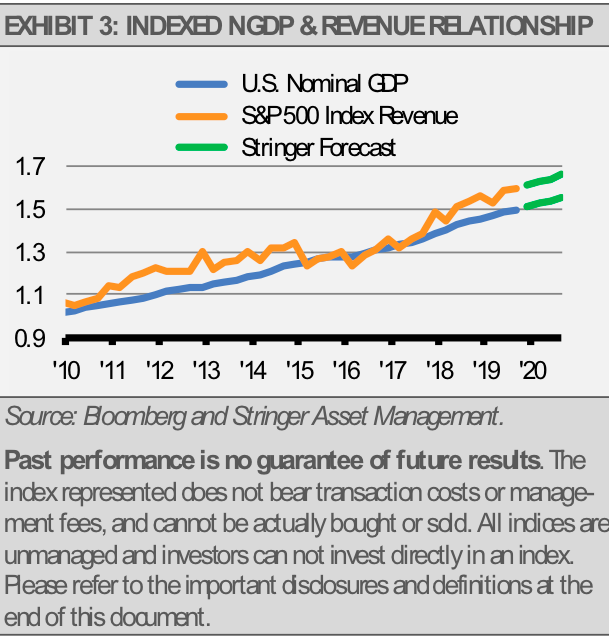
Considering these GDP and revenue growth rates as well as current equity valuations, we are forecasting a 7% annualized total return on U.S. equities over the coming decade. Our work suggests than any recession we might see in the coming years is likely to be shallow and short-lived largely due to tighter regulations and lack of bank industry leverage. Despite a slower pace of growth, our projections suggest a doubling of the value of an equity investment over the next decade, bouts of volatility notwithstanding.
Our posture remains relatively conservative while have added to areas we think are attractive. As a result of our expectations for slow growth and volatility, we favor a strategy focused on high quality, consistent dividend and interest income coupled with investments in areas that we think still offer attractive relative values. These areas include longer-duration, high quality bonds and tactical investments in high dividend income global infrastructure companies for our income-oriented Strategies as well as a broad assortment of information technology companies, with an emphasis on the semiconductor space, for our growth-oriented Strategies. Given our expectation for interest rate stability, longer-duration bonds and high dividend income global infrastructure companies look attractive. Furthermore, while global equity markets have appreciated, we think that the semiconductor space still trades at a discount to historical valuations.
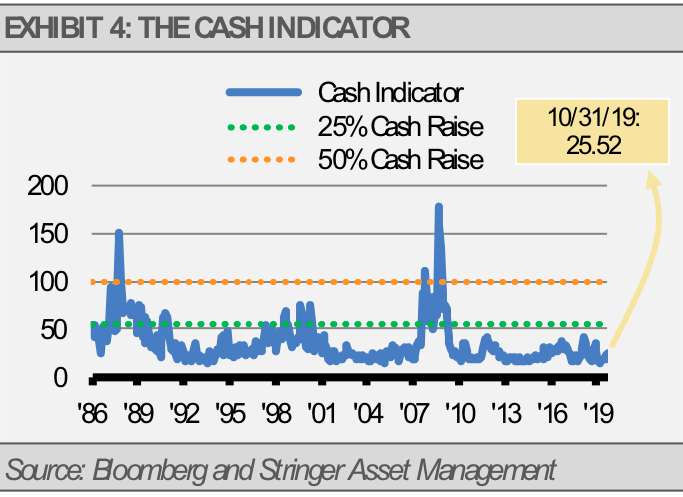
CASH INDICATOR
The Cash Indicator (CI) has risen closer to the mid-point of its recent range but remains slightly below the long-term median of 28. This movement suggests that a moderate level of risk is reflected in the markets. While the CI has risen to its highest level since January 2019, it is still far below a crisis level. With the U.S. economic backdrop stable, this suggests that market declines are likely buying opportunities.
This article was written by Gary Stringer, CIO, Kim Escue, Senior Portfolio Manager, and Chad Keller, COO and CCO at Stringer Asset Management, a participant in the ETF Strategist Channel.
DISCLOSURES
Any forecasts, figures, opinions or investment techniques and strategies explained are Stringer Asset Management LLC’s as of the date of publication. They are considered to be accurate at the time of writing, but no warranty of accuracy is given and no liability in respect to error or omission is accepted. They are subject to change without reference or notification. The views contained herein are not be taken as an advice or a recommendation to buy or sell any investment and the material should not be relied upon as containing sufficient information to support an investment decision. It should be noted that the value of investments and the income from them may fluctuate in accordance with market conditions and taxation agreements and investors may not get back the full amount invested. Past performance and yield may not be a reliable guide to future performance. Current performance may be higher or lower than the performance quoted.
The securities and strategies identified and described may not represent all of the securities purchased, sold or recommended for client accounts. The reader should not assume that an investment in the securities identified was or will be profitable.
Data is provided by various sources and prepared by Stringer Asset Management LLC and has not been verified or audited by an independent accountant.
Index Definitions:
S&P 500 Index – This Index is a capitalization-weighted index of 500 stocks. The Index is designed to measure performance of a broad domestic economy through changes in the aggregate market value of 500 stocks representing all major industries.