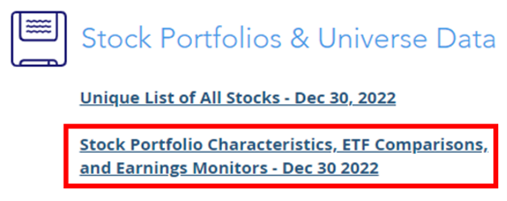
Astoria has recently created a new tool that provides further insights into our various stock portfolios, available on our website and updated on a monthly basis. Head to the Tools section of our website (click here), scroll down to the section called Stock Portfolios & Universe Data on the bottom right, and click the link seen below. If you need the password for this section of our website, please contact us:
In this dashboard, you will come across four main sections:
1. Stock Portfolio Comparisons
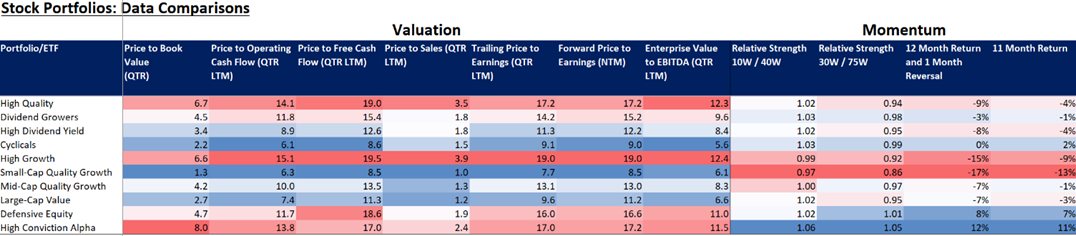
- Here you can view and compare portfolio level metrics spanning various factors, such as valuation, quality, or dividend, across all our stock portfolios.
- For instance, we can see that the Forward PE of Large-Cap Value is cheaper than that of High Growth (11.2 vs. 19.0).
- We can also see that out of the 10 US stock portfolios Astoria manages, High Dividend Yield, Cyclicals, Small-Cap Quality Growth, Large-Cap Value, and Mid-Cap Quality Growth are the only portfolios trading at a discount to the market (SPY PE = approx. 17). Growth stocks (while having their valuations compressed) still remain expensive. The same goes for High Quality and Defensive Equity (although these typically stay expensive as the cycle turns south). Our view is that as long as the terminal rate stays high, we will be in a period of value outperforming growth. Our preference is to tilt away from US index, growth, defensives and towards value, small/mid-cap, and Non-US.
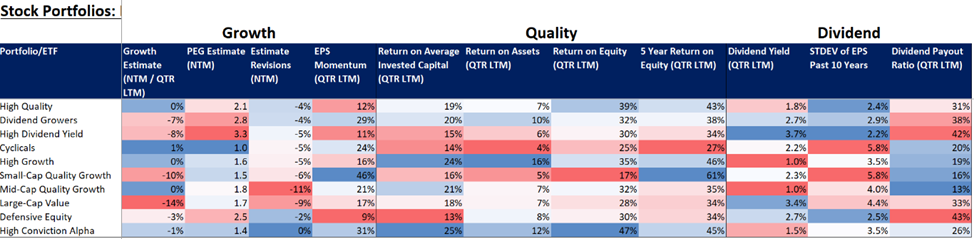
- Additionally, although the yield of our High Dividend Yield Portfolio is greater than that of our Dividend Growers Portfolio (3.7% and 2.7%, respectively), we can conclude that our Dividend Growers Portfolio has higher quality characteristics:
- Dividend Growers ROIC, ROA, and ROE = 20%, 10%, and 32%, respectively
- High Dividend Yield ROIC, ROA, and ROE = 15%, 6%, and 30%, respectively
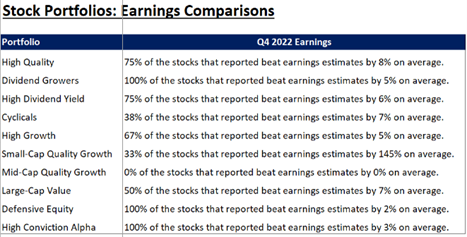
- Lower on the sheet, there is an earnings summary for each stock portfolio detailing the percentage of stocks within each portfolio that beat earnings estimates, and how much the average beat was.
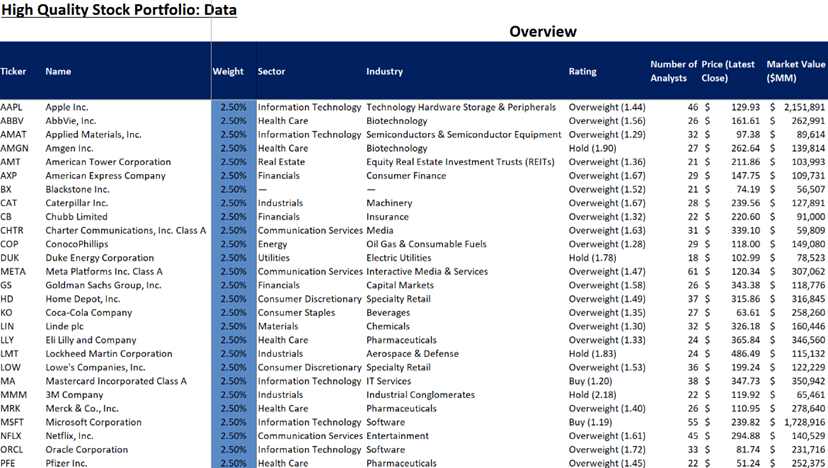
2. Constituent Level Data
- Here you will find each stock within a stock portfolio, as well as constituent level data such as GICS sector/industry, FactSet ratings, market value, and metrics across the various factors previously described.
- Within these sheets, we also include trailing returns for each stock on a 1-year, 3-month, 1-month, 10-day, and 5-day basis.
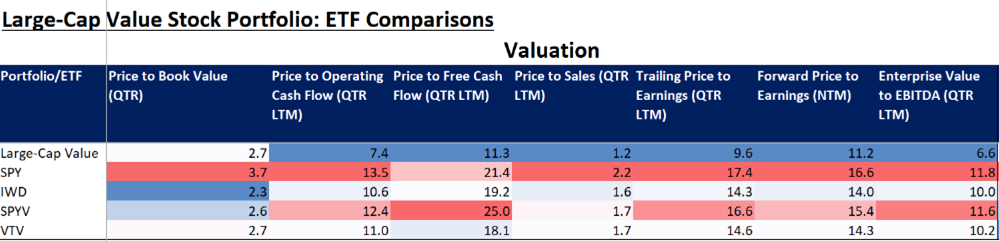
3. ETF Comparisons
- Using aggregate statistics, this section of the dashboard can be used to compare metrics across factors for Astoria’s stock portfolios versus the market via SPY or similar themed/benchmark-like ETFs.
- As an example, our Large-Cap Value portfolio ranks cheaper than SPY and comparable value ETFs (IWD, SPYV, VTV) across several valuation metrics.
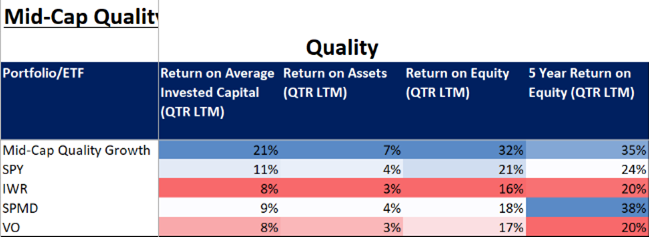
- Moreover, our Mid-Cap Quality Growth portfolio demonstrates higher quality characteristics than SPY and comparable mid-cap ETFs (IWR, SPMD, VO).
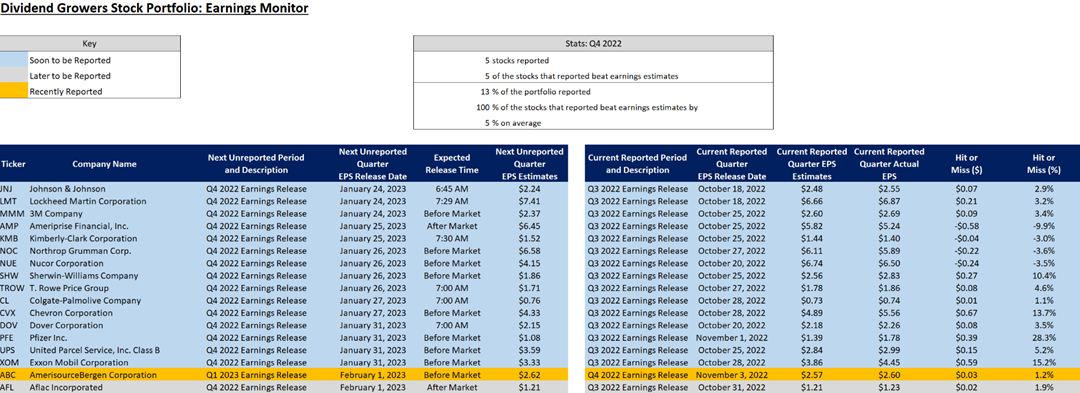
4. Earnings Monitors
- This section provides earnings information, including release time, earnings estimates, actual reported earnings, and hit or miss percentages, for each stock within a portfolio.
- It also describes the portion of the portfolio that has reported, how many stocks beat, and what the average beat was on a portfolio level basis. As seen below, 100% of the stocks in Dividend Growers that have reported earnings for Q4 2022 have beat earnings estimates by 5% on average.
Best,
Nick
Source: FactSet. Metric and return data as of 12/30/2022. All ratio data retrieved is based on a quarterly last twelve months basis unless otherwise denoted. All estimate data retrieved is based on a next twelve months basis unless otherwise denoted. All return info is as of 12/30/2022 and is calculated in USD. Portfolio level momentum metrics and standard deviation of EPS over the past 10 years are based on averages of individual stock metrics. These portfolio level metrics only represent the current portfolio constituents and do not reflect past rebalances or actual account performance. All earnings data retrieved on 1/20/2023. Past performance is not indicative of future results.
Astoria Portfolio Advisors Disclosure: As of this publication Astoria Portfolio Advisors held positions in SPY, SPMD, and all stocks pictured above on behalf of its clients. Past performance is not indicative of future performance. Any third-party websites provided on www.astoriaadvisors.com are strictly for informational purposes and for convenience. These third-party websites are publicly available and do not belong to Astoria Portfolio Advisors LLC. We do not administer the content or control it. We cannot be held liable for the accuracy, time-sensitive nature, or viability of any information shown on these sites. The material in these links is not intended to be relied upon as a forecast or investment advice by Astoria Portfolio Advisors LLC and does not constitute a recommendation, offer, or solicitation for any security or investment strategy. The appearance of such third-party material on our website does not imply our endorsement of the third-party website. We are not responsible for your use of the linked site or its content. Once you leave Astoria Portfolio Advisors LLC’s website, you will be subject to the terms of use and privacy policies of the third-party website. Refer here for more details.
Photo Source: Astoria Portfolio Advisors