

true. The data clearly show that rapid-fire trading leads to inferior performance. Chart 2 shows the probability of a negative return for the S&P 500® for varying time horizons. The probability of losing money uniformly decreases for each longer time horizon.
CHART 2:
Probability of a Loss for the S&P 500® (Rolling Price Returns, Jan.1930 thru May 2018)
![]()
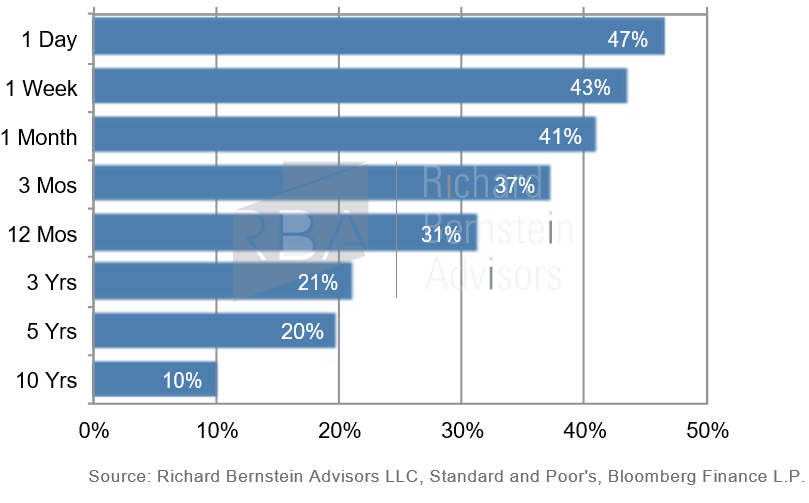
Economies simply don’t change day by day. Therefore, risk decreases as one extends investment time horizons probably because longer time horizons allow fundamentals to develop, whereas short-term investing is largely based on meaningless noise.
Chart 3 compares the performance of “event-driven” strategies to that of global equities. Over the last five years, event-driven strategies have returned 1.2% per year versus the MSCI All Country World Index (ACWI) return of 9.5% per year. Chasing events certainly hasn’t been an outperforming strategy.
One might suggest that event-driven strategies protect against down markets. While that might indeed be true, Chart 2 pointed out that stocks provide negative returns only 31% of one-year periods and only 20% of five-year periods. One needs to remember that overall fundamentals improve more often than they deteriorate.
CHART 3:
HFRI Event Driven Index vs. MSCI ACWI Index May 31, 2013 – May 31, 2018
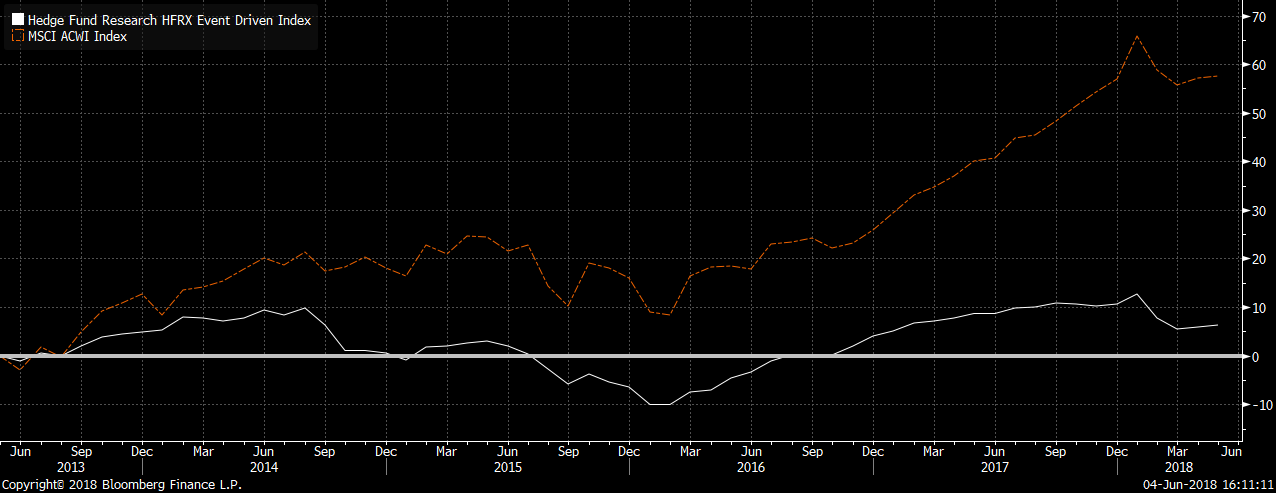
Source: Bloomberg Finance L.P. For Index descriptors, see “Index Descriptions” at end of document.
Ignore the tweet. Invest for the meat.
Watching daily events unfold is always mesmerizing, but the data show that it is extraordinarily difficult to invest fruitfully attempting to time short-term events. At RBA, we try to stay dispassionate and disciplined and we extend our investment time horizons because the meat of the investment matter is fundamentals and not the hair-on-fire event of the day.
To learn more about RBA’s disciplined approach to macro investing, please contact your local RBA representative. www.rbadvisors.com/images/pdfs/Portfolio_Specialist_Map.pdf.