
By Rob Glownia, Chris Konstantinos, Doug Sandler and Rod Smyth, RiverFront Investment Management
Why We Aren’t Currently Concerned
The 3-month/10-year yield curve inverted last Friday. If you’re not exactly sure what that means, you’re not alone, considering Google searches for the term “yield curve” apparently spiked last Friday! Therefore, we’re dedicating this Weekly View to explain the yield curve, discuss why it’s now inverted, and suggest how investors should react to this information.
What Is A Yield Curve?
The yield curve is the relationship between shorter and longer-term interest rates. A line drawn through the different interest rate maturities, from the Fed Funds overnight rate to 30-year bond yields, is rarely a straight line and so often resembles a curve. Most of the time, this curve is upward sloping, with short-term interest rates typically lower than long-term interest rates. This is because investors demand a premium for having their rates fixed for longer periods of time.
What Is An Inverted Yield Curve?
Long story short, an inverted yield curve means that short term interest rates are higher than long term interest rates. As mentioned above, investors typically demand higher interest rates for longer maturities. However, when bond investors feel like the Federal Reserve has already raised interest rates too high, or that a recession is imminent, long-term rates can fall below short-term ones, “inverting” the shape of the curve. This phenomenon is mostly observed in the later stages of an economic cycle and the yield curve has inverted prior to the last 7 recessions in the United States, dating back to 1970.
We’re Not Currently Concerned About The Inverted Curve
Although it’s always dangerous to assume “it’s different this time,” we don’t believe investors should consider this inversion as a signal for an imminent recession. There are a few reasons for this conclusion:
- We’re still in a low interest rate environment with few signs of inflation.
- Global central bank action has depressed long term rates, distorting the signal.
- As the yield curve has become more closely monitored, it is unlikely to be the valuable ‘early warning’ indicator it once was.
We’ll discuss each of these reasons below.
Interest Rates and Inflation are Still Low: Despite the Fed’s hiking cycle in 2018, absolute interest rates are still extremely low relative to history.
The Federal Reserve is also in a much different position today relative to prior periods that the yield curve inverted. Historically short-term rates were hiked by the Federal Reserve, sometimes intentionally above long-term rates, in hopes to stave off inflation and cool down the economy. As short-term rates go higher, levered companies and individuals are forced to deal with higher costs of capital, which eventually leads to recession.
In 2018 the Fed was following a more typical rate hiking pattern, which they expected to continue. In a dramatic turnaround the Fed recently pivoted its policy noting that there are few signs of inflation and that they will exhibit patience regarding any future rate increases. Even with the curve inverted, borrowing costs are still affordable and capital markets continue to function well. In fact, as rates have recently fallen, companies have been able to refinance and service their debt at even more attractive levels. For these reasons, we do not foresee a credit induced crisis that leads to a recession over the next twelve months.
Global Central Banks have been Exceptionally Accommodative: For the last decade, Central Banks have suppressed interest rates through various quantitative easing (QE) programs, which involved buying bonds. This has been evident in the US, but also in Europe and Japan, where these economies have faced even more deflationary pressures and slower growth prospects. QE programs, combined with maturity targeting by the central banks have dramatically increased the quantity of short-term securities available, while significantly decreasing the availability of longer-maturity bonds. Given these changes to short-term and long-term supply, it is not surprising to see upward pressure on short-term rates and downward pressure on long-term rates. The net result, in our view, is that the yield curve has been distorted by QE and that the efficacy of inversion as a recession signal has been diluted.
Furthermore, we believe the decline in US long-term interest rates is less due to the US economic trajectory and more the result of slowing economies in Asia and Europe. While this is a legitimate concern, we expect these economies will start to recover in the 2nd half of this year due to current efforts by governments and central banks, especially in China.
Yield Curve Has Gone Mainstream: Generally, you don’t get hit by the train you see coming (unless you’re tied to the tracks, like in an old Western Movie). Given the historical success of the yield curve as a recession signal, it has become more popular and has a lot of eyes watching it. Consistent with the old adage, ‘a watched pot never boils’, we believe it is unlikely that this recession signal will remain the sure-fire indicator that it was in the past.
Imperfect Track Record: We shouldn’t forget that the 3M/10Y yield curve did invert in the late 1960’s without a recession to follow. Furthermore, it came close to inverting in 1998, but the next recession didn’t come until a few years afterward. In fact, while this signal might have called the last 7 recessions, it gives no indication regarding the timing of the next recession. As you can see in the chart of the week, the yield curve initially inverted almost two years prior to the Global Financial Crisis.
3M/10Y Yield Curve – Chart of the Week:
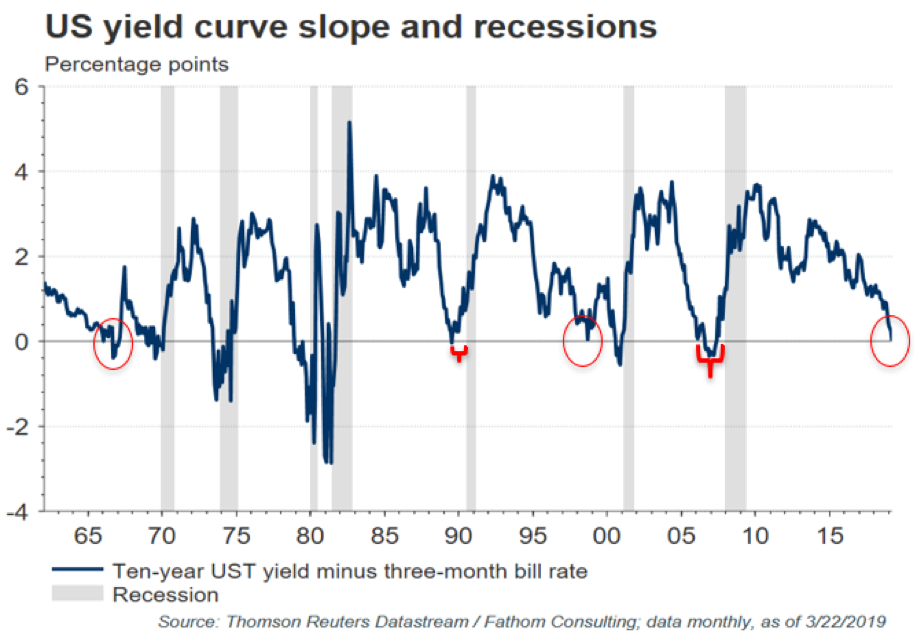
Source: Thomson Reuters Datastream/Fathom Consulting; data monthly, as of 3/22/19. Past performance is no guarantee of future results. Shown for illustrative purposes only.
BOTTOM LINE
Yield curve inversions have typically been an ominous sign for investors and have been an indication of upcoming recession. However, we feel the current economic environment casts doubt on this signal, for the reasons laid out in this piece. Therefore, we are not ready to shift our strategy of preferring equities over bonds. Furthermore, we do not believe the US will enter recession in 2019.
However, it is always dangerous to assume that “it’s different this time.” Therefore, we will continue to observe this relationship closely, as well as monitor the way in which other market participants interpret the signal. Markets can be vulnerable in the short-run when common rules-of-thumb get violated, because investors commonly ‘shoot first’. Therefore, we continue to expect heightened volatility over the coming weeks.
Important Disclosure Information
The comments above refer generally to financial markets and not RiverFront portfolios or any related performance. Past results are no guarantee of future results and no representation is made that a client will or is likely to achieve positive returns, avoid losses, or experience returns similar to those shown or experienced in the past.
Information or data shown or used in this material is for illustrative purposes only and was received from sources believed to be reliable, but accuracy is not guaranteed.
In a rising interest rate environment, the value of fixed-income securities generally declines.
Technical analysis is based on the study of historical price movements and past trend patterns. There are no assurances that movements or trends can or will be duplicated in the future.
Small-, mid- and micro-cap companies may be hindered as a result of limited resources or less diverse products or services and have therefore historically been more volatile than the stocks of larger, more established companies.
Investing in foreign companies poses additional risks since political and economic events unique to a country or region may affect those markets and their issuers. In addition to such general international risks, the portfolio may also be exposed to currency fluctuation risks and emerging markets risks as described further below.
Changes in the value of foreign currencies compared to the U.S. dollar may affect (positively or negatively) the value of the portfolio’s investments. Such currency movements may occur separately from, and/or in response to, events that do not otherwise affect the value of the security in the issuer’s home country. Also, the value of the portfolio may be influenced by currency exchange control regulations. The currencies of emerging market countries may experience significant declines against the U.S. dollar, and devaluation may occur subsequent to investments in these currencies by the portfolio.
Foreign investments, especially investments in emerging markets, can be riskier and more volatile than investments in the U.S. and are considered speculative and subject to heightened risks in addition to the general risks of investing in non-U.S. securities. Also, inflation and rapid fluctuations in inflation rates have had, and may continue to have, negative effects on the economies and securities markets of certain emerging market countries.
Stocks represent partial ownership of a corporation. If the corporation does well, its value increases, and investors share in the appreciation. However, if it goes bankrupt, or performs poorly, investors can lose their entire initial investment (i.e., the stock price can go to zero). Bonds represent a loan made by an investor to a corporation or government. As such, the investor gets a guaranteed interest rate for a specific period of time and expects to get their original investment back at the end of that time period, along with the interest earned. Investment risk is repayment of the principal (amount invested). In the event of a bankruptcy or other corporate disruption, bonds are senior to stocks. Investors should be aware of these differences prior to investing.
RiverFront Investment Group, LLC, is an investment adviser registered with the Securities Exchange Commission under the Investment Advisers Act of 1940. The company manages a variety of portfolios utilizing stocks, bonds, and exchange-traded funds (ETFs). RiverFront also serves as sub-advisor to a series of mutual funds and ETFs. Opinions expressed are current as of the date shown and are subject to change. They are not intended as investment recommendations.
RiverFront is owned primarily by its employees through RiverFront Investment Holding Group, LLC, the holding company for RiverFront. Baird Financial Corporation (BFC) is a minority owner of RiverFront Investment Holding Group, LLC and therefore an indirect owner of RiverFront. BFC is the parent company of Robert W. Baird & Co. Incorporated (“Baird”), a registered broker/dealer and investment adviser.
Copyright ©2019 RiverFront Investment Group. All Rights Reserved. 794027