

We have written about three important domestic characteristics that we think will act as pillars to support impressive U.S. eco-nomic growth in the decade ahead: strong household balance sheets, strong corporate balance sheets, and positive demo-graphic trends. A fourth pillar of economic growth is the fractur-ing of global trade networks.
Previous decades saw the development of global trade networks in the post-WWII period initially driven by U.S. geopolitical con-siderations with the Bretton Woods Agreement as its center-piece. Bretton Woods was largely based on the premise that stronger economic ties would reduce the risk of military confron-tations. This idea proliferated around the globe with various trade agreements including the French-German ties that eventually led to the Eurozone.
With the U.S. Navy patrolling and protecting the oceans, govern-ments could focus on economic rather than military development to secure resources their countries needed. Supply chains could span continents and oceans with little risk of disruption.
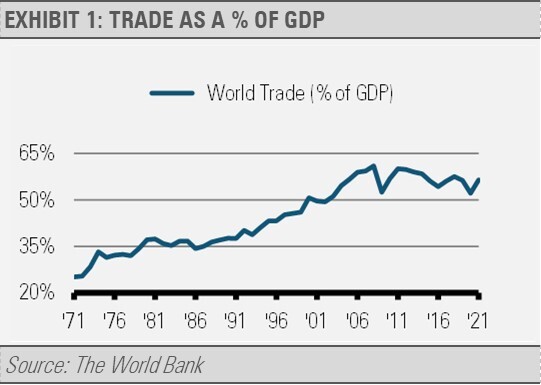
Over the years, this led to global manufacturing, just-in-time effi-ciencies, the World Trade Organization, and many other improve-ments. As exhibit 1 details, international trade as a percentage of global economic activity rose from just 25% in the early 1970s to a peak of 61% in 2008 before falling sharply on the Global Finan-cial Crisis (GFC).
After a brief recovery following the GFC, global trade as a per-centage of GDP began to fall again. It’s important to note that the decline of global trade as a percentage of GDP began more than a decade before the global pandemic laid bare the geopolitical and economic risks associated with such cross-ocean reliance on countries, regions, and trading blocs not necessarily aligned with our best interests.
There is a growing concern among economists about global trade network fracturing. A fracturing of these networks that were es-tablished after World War II and that have encompassed nearly the entire globe, especially since China joined the World Trade Organization in 2001, could upend national economies dependent on that trade.
Headlines abound with stories of a China-oriented trading bloc that would include Russia as well as other emerging market countries. Such developments might serve to push global trading networks to a breaking point with trading blocs favoring their own at the potential detriment to other nations.
Fracturing would be a significant step backwards in terms of global economic development. According to the IMF, global eco-nomic integration has helped billions of people become wealthier, healthier, and better educated. Since the end of the Cold War, the size of the global economy roughly tripled, and nearly 1.5 billion people were lifted out of extreme poverty. On the surface, fracturing of global trade could represent a big challenge to the U.S. economy as well.
According to The Office of the U.S. Trade Representative, we are the world’s largest trading nation, with over $5.6 trillion in exports and imports of goods and services in 2019. The U.S. has trade relations with more than 200 countries, territories, and regional associations around the globe.
With so much trade happening between the U.S. and the rest of the world, major changes in global trading networks is certain to impact us. However, the U.S. economy is so diversified, and its primary trading networks are so well protected, that the impact on the U.S. of a fracturing of global trade would be far less impactful
than on other major economies.
For example, according to the Organization for Economic Cooperation and Development (OECD) trade as a percentage of GDP, the U.S. ranks lowest of all OECD countries. According to World Bank data, the U.S. sits between Ethiopia and Pakistan based on global trade as a percentage of GDP. Though the nominal numbers for U.S. trade are large because the U.S. economy is huge, as a percentage of U.S. economic activity, global trade is just not as impactful. For other major economies, such as China, Germany, and Japan, global trade accounts for a larger percentage of overall economic activity.

Furthermore, the U.S. has trade networks that are well protected from geopolitical and other risks. Canada and Mexico are its largest trading partners, so a huge percentage of U.S. trade is contained within North America. According to the Bureau of Economic Analysis, combined trade with Canada and Mexico accounted
for 26% of U.S. exports and 24% of U.S. imports in 2021.
That compares to just 8% of exports and 15% of imports for China, 4% of exports and 5% of imports for Germany, and 4% of exports and 5% of imports for Japan. Unlike other countries, such as China, Germany, and Japan, that source resources from long trade routes spanning oceans and continents, the U.S.’s closest neighbors are both strong allies and its biggest trading partners. As global trade fractures over the
coming decade, we expect to see the U.S. continue to focus on onshoring and nearshoring, bringing manufacturing back to the U.S. as its closest neighbors. The U.S. will likely strengthen trade
ties with Canada and Mexico, as well as other Western Hemisphere countries in addition to some other friendly nations around the globe.
These initiatives by both the government and the private sector will primarily serve to fortify supply chains against geopolitical risks. For example, the CHIPS and Science Act of 2022 created roughly $50 billion in federal subsidies for semiconductor companies to manufacture chips domestically. In addition to fortifying against supply chain and other risks, these developments offer huge growth opportunities, in our view.
Furthermore, The United States-Mexico-Canada Agreement (USMCA) ties together a trading bloc that is home to over 490 million people, with a projected population of over 530 million by 2030. This growing population represents a significant consumer base for businesses operating within the trading bloc and is likely
to drive significant demand for goods and services in the years to come.
In addition to its favorable demographics, the USMCA is also home to a significant and growing middle class. According to the World Bank, over 60% of the population in the US, Mexico, and Canada will be considered middle class by 2030, up from around 50% in 2000. Middle-class consumers tend to have higher levels
of disposable income and are more likely to spend on discretionary items, such as travel, entertainment, and luxury goods. To summarize, of the major global economies, the U.S. is less at risk of economic turmoil resulting from potential global trade fracturing. With an economy most focused on its North American trading bloc, the U.S. stands above all others when it comes to resilience to economic impacts of geopolitical risks and has potential
for great economic growth in the decade to come.
For more news, information, and analysis, visit the ETF Strategist Channel.
DISCLOSURES
Any forecasts, figures, opinions or investment techniques and strategies explained are Stringer Asset Management, LLC’s as of the date of publication. They are considered to be accurate at the time of writing, but no warranty of accuracy is given and no liability in respect to error or omission is accepted. They are subject to change without reference or notification. The views contained herein are not be taken as an advice or a recommendation to buy or sell any investment and the material should not be relied upon as containing suffi-cient information to support an investment decision. It should be noted that the value of investments and the income from them may fluctuate in accordance with market conditions and taxation agreements and investors may not get back the full amount invested.
Past performance and yield may not be a reliable guide to future performance. Current performance may be higher or lower than the performance quoted.
described may not represent all of the securities purchased, sold or recommended for client accounts. The reader should not assume that an investment in the securities identified was or will be profitable.
Data is provided by various sources and prepared by Stringer Asset Management, LLC and has not been verified or audited by an inde-pendent accountant.