

By Gary Stringer, Kim Escue and Chad Keller, Stringer Asset Management
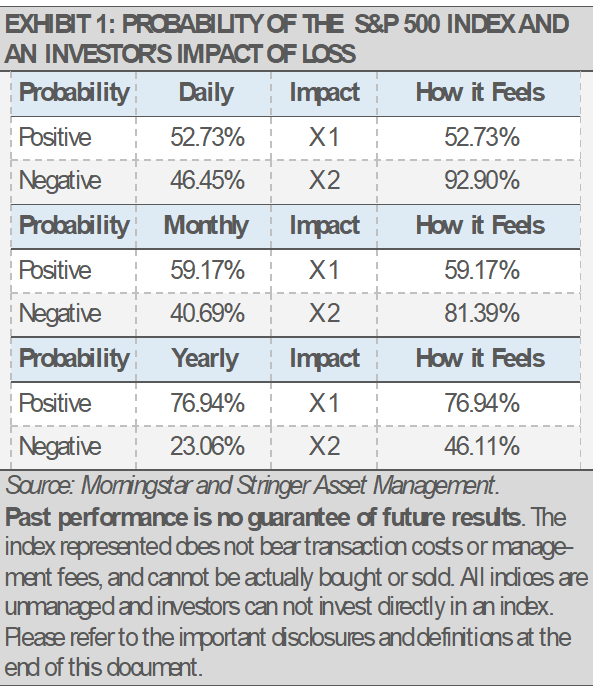
From domestic politics and geopolitical risks to slowing economic growth and market volatility, today’s headlines can unnerve investors. For example, behavioral finance teaches us that downside volatility impacts how we feel at least twice as much as the euphoria of gains (exhibit 1). As human beings, the negative emotions we feel during down markets can cause us to make investment decisions that we might later regret. In fact, studies suggest that just looking at the performance of an equity portfolio frequently can hurt investment results. We think that when investors feel bad about their investments in a down market, they often make emotional decisions that result in selling low and missing out on future gains.
Furthermore, most market volatility passes relatively quickly with declines soon followed by a recovery as the following table illustrates (exhibit 2). As such, volatility is inherent in equity investing.
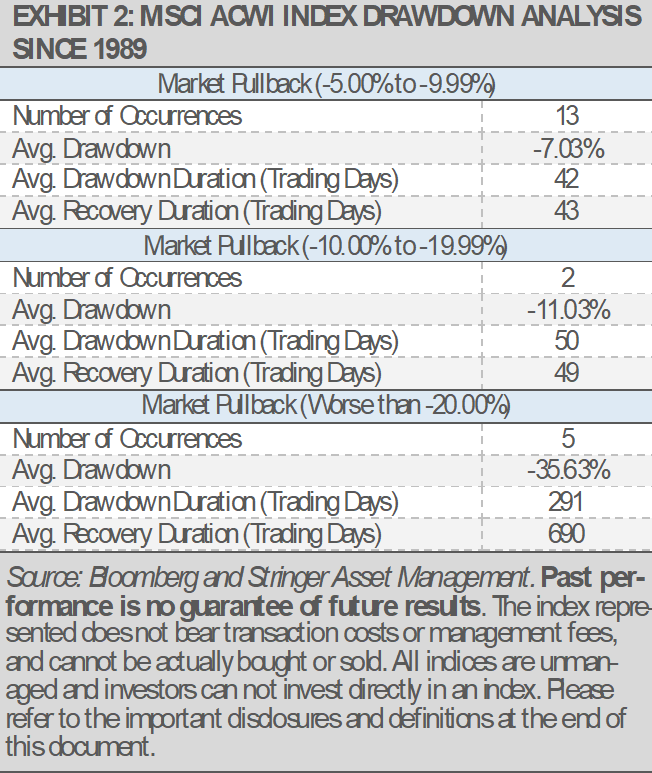
Recall how you felt during the market declines of early 2016, which saw the worst January in U.S. stock market history, or late 2018 when we saw the worst December in U.S. stock market history. In both instances, the U.S. stock market climbed to new highs shortly after hitting the bottom. Understanding this concept and following a disciplined investment management process can help investors better navigate challenging times.
Additionally, it’s important to note that U.S. economic fundamentals remain solid though somewhat lackluster. In aggregate, the indicators that we track, such as liquidity growth, layoffs, business surveys, and industrial metals’ price action, suggest slow and stable economic growth.
When the economy is accelerating, we tend to see liquidity growth increasing, layoffs falling, along with business surveys and industrial metals prices turning significantly higher. When the economy is about to contract, we tend to see the opposite happening with each of these measures. Currently, each of these indicators is suggesting continued slow U.S. economic growth (exhibits 3 and 4).
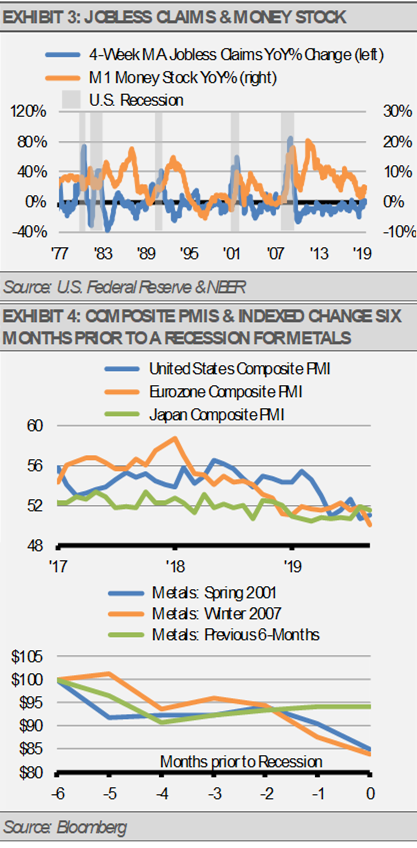
The slowdown in the pace of U.S. jobs creation confirms the slowdown in the pace of economic growth and the continuation of the business cycle with no near-term recession in our view.
We prefer to track jobs creation on a rolling basis rather than monthly due to the volatility of the monthly numbers. As the U.S. labor force grows by approximately 100,000 new entrants per month, an average monthly jobs creation rate near 100,000 new jobs per month or better signals health for the labor market.

Importantly, slow economic growth can still lead to investment gains. Any growth should support advancements in corporate revenue and earnings. In turn, more earnings can support larger dividends and higher stock prices.
With this as a backdrop, we have shifted our allocations to participate in potential equity market gains while mitigating volatility risks. As a result, each of our Strategies currently offers higher yield than their respective benchmarks and significantly less volatility risk than the overall global equity market.
As equity markets near all-time highs, interest rates remain historically low, and economic growth stabilizes at a slower pace, we expect future returns to be modest. Our analyses continue to suggest that equity markets will move higher, but future gains may be both volatile and harder to achieve. Furthermore, we expect long-term interest rates to stabilize.
We expect that political developments in Washington, D.C. will create a lot of headlines and some market volatility. However, the fundamentals of the U.S. economy and the markets are not driven by what happens inside the beltway. Regardless of what we may see in the headlines, political developments cannot derail our economy and markets. We enjoy a robust economy driven by the private sector, not by government mandate.
Positive demographic trends and industry innovation will continue to support economic growth in our view. Nearly 90% of U.S. economic activity occurs within our borders. Of the major economies around the world, none relies less on the health of other economies than we do, and the U.S. is the most insular major economy in the world today.
THREE LEVELS OF RISK MANAGEMENT
As our process allows us to manage risk in real time, we have adjusted our Strategies to weather market volatility while still participating in potential market appreciation. We manage risk at three levels within each of our Strategies. First, we manage risk within our strategic, long-term allocations based on diversification across low-correlated assets and a focus on areas where we find more attractive relative values. Secondly, we manage risk tactically over the short-term by investing across a broad array of themes and asset classes including cash. Lastly, our proprietary Cash Indicator methodology acts as a plan in case of an emergency. Each of these systems work together to potentially help smooth the ride for investors.
Within our strategic equity allocations, we have increased our exposure to domestic equities that tend to exhibit lower volatility and more consistency. Going forward, we expect that diversified alternative investments will be an important source for non-correlated and consistent returns. Additionally, our high-quality core fixed income should act as a ballast to potential equity market volatility.
Tactically, we favor low volatility equity, global infrastructure investments, domestic dividend growth equity in our more equity-oriented Strategies, as well as diversified alternative income, and taxable municipal bonds depending on the Strategy. In 2019 and into 2020, we think that it will be critical for investors to be ready for market volatility and increased economic risks.
We also think it will be important to continue to put risk first while also being ready to act tactically to benefit from continued equity market upside. Equally important, we think that investors should be ready to take defensive tactical positions, along with the willingness and ability to raise cash up to 50% of a portfolio as can be done via our Cash Indicator methodology.
We are watching our indicators closely and will make changes quickly if necessary as you have seen. That flexibility is one of the benefits of including a tactical allocation where we can manage risk in real time.
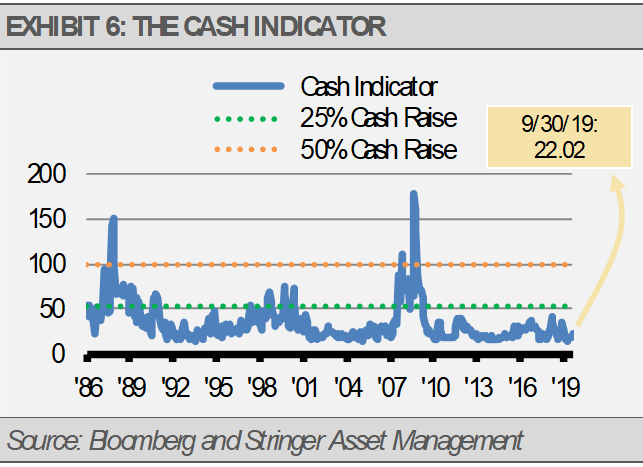
THE CASH INDICATOR
The Cash Indicator (CI) has elevated closer to historical levels, which is reflective of recent market volatility. While the CI suggests that we are far from a crisis, we should expect volatility. Still, increased volatility is likely not a sign of a crisis.
This article was written by Gary Stringer, CIO, Kim Escue, Senior Portfolio Manager, and Chad Keller, COO and CCO at Stringer Asset Management, a participant in the ETF Strategist Channel.
DISCLOSURES
Any forecasts, figures, opinions or investment techniques and strategies explained are Stringer Asset Management LLC’s as of the date of publication. They are considered to be accurate at the time of writing, but no warranty of accuracy is given and no liability in respect to error or omission is accepted. They are subject to change without reference or notification. The views contained herein are not be taken as an advice or a recommendation to buy or sell any investment and the material should not be relied upon as containing sufficient information to support an investment decision. It should be noted that the value of investments and the income from them may fluctuate in accordance with market conditions and taxation agreements and investors may not get back the full amount invested. Past performance and yield may not be a reliable guide to future performance. Current performance may be higher or lower than the performance quoted.
The securities and strategies identified and described may not represent all of the securities purchased, sold or recommended for client accounts. The reader should not assume that an investment in the securities identified was or will be profitable.
Data is provided by various sources and prepared by Stringer Asset Management LLC and has not been verified or audited by an independent accountant.
Index Definitions:
MSCI ACWI Index – This Index is a free float-adjusted market capitalization weighted index that is designed to measure the equity market performance of developed and emerging markets. The MSCI ACWI Index consists of 23 developed and 23 emerging market country indexes. Net total return includes the reinvestment of dividends after the deduction of withholding taxes, using a tax rate applicable to non-resident institutional investors who do not benefit from double taxation treaties.
S&P 500 Index – This Index is a capitalization-weighted index of 500 stocks. The Index is designed to measure performance of a broad domestic economy through changes in the aggregate market value of 500 stocks representing all major industries.