GLOBALT’S KEY POINTS
- The newest COVID variant has not produced a surge of infection in a heavily COVID exposed/vaccinated US
- GDP growth is dependent upon productivity gains and population growth.
- The Fed has laid bare more concrete plans for Quantitative Tightening.
- Valuations are dependent upon low rates and the path of inflation.
- Rates (believe it or not) still remain within historical ranges.
- Inflation has been more persistent than we originally believed.
- Employment has rebounded, but structural full employment remains elusive, and job growth has been tepid.
- Fundamentally, risks are skewed to the downside, but unprecedented liquidity is supporting markets.
- The environment remains well suited to active management.
OUTLOOK
As is often the case, the things investors are most focused on matter the least. An inversion in the yield curve is well underway, well telegraphed and analyzed ad nauseum. For as much evidence there is that an inversion presages recession, both the timing of the actual downturn and predictive accuracy of the signal are far from infallible. The most posed questions we get are “Are we headed for a recession?” and “when?”
The answer to the former, is yes. There will always be periods of zero to negative GDP growth if only given the cyclical nature of the economy. There are environments we surmise that have consistently resulted in economic instability (and therefore market instability) almost all having to do with the manipulation of monetary policy. When the Fed begins to tighten, something almost always springs a leak. When something breaks, the response has been to try to fix it with an ever-larger policy response. With each iteration, more intervention is viewed to be necessary to stabilize whatever asset class has become disorderly. The reversal of quantitative easing certainly takes us into uncharted territory. The Fed’s Waller said the bank needs to fight inflation without stressing markets, destroying jobs, or risking recession while acknowledging at the same time inflation has likely peaked.
Again, we highlight the tightwire the Fed must walk. How long can inflation be allowed to persist without impairing consumer demand which has driven our economy since manufacturing took a back seat to consumerism as a percentage of GDP? Most importantly, are the Fed’s traditional tools effective in today’s arguably uncharted waters? The Fed has been using its “toolbox” to stimulate inflation and growth since 2008 with little effect. While we have inflation, it only occurred as the result of the supply chain disruptions related to a worldwide pandemic. The idea that the same demonstrably ineffective set of tools can curb inflation in the same way it did to engender inflation in a much less distorted market is dubious. The prevailing fear is that inflation will restrain spending, resulting in weaker economic growth, while Fed rate hikes push us into recession.
The usual suspects are in play. Corporate earnings growth is slowing, cost pressures continue unabated for both consumers and businesses (fuel, staffing, shipping, raw materials), and rates are likely to at least subdue a raging housing market – a significant store of consumer wealth as well as a source of economic growth multipliers. On the positive side, valuations have corrected dramatically, the consumer is relatively healthy, inflation is believed to have peaked (we shall see), European central banks are less hawkish, China is stimulating, manufacturing levels are stable and headline employment is tight.
The Fed has engineered just one soft landing, that is, where they tightened policy, but something did not break, and a recession was averted. Of course, from an investment point of view, what matters not so much as whether there is a recession or not, but how the markets react to it, as we approach it, it unfolds, and then resolves.
We highlight below a compilation of conditions common concurrently with a stock market top. Strategas has been diligently accumulating these since 2003 and are shown in the table below.
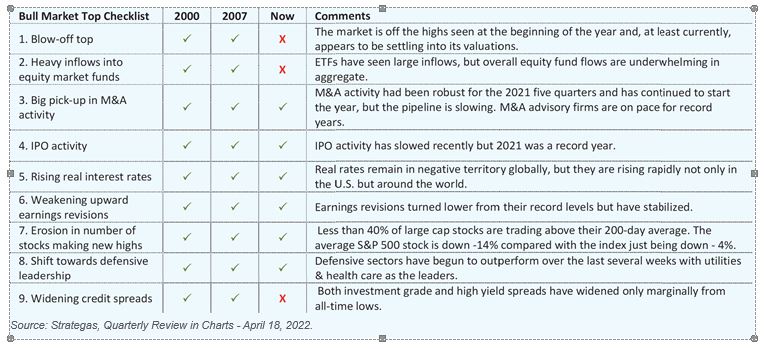
On a more esoteric level, when strategists are racing to forecast rising recession probabilities before their competitors and retail investors are searching these topics on the internet, we posit the news is already reflected in market prices. The next move is likely in the opposite direction – lower recession risk and slower inflation rates. Like sentiment, consensus is one of our favorite contra-indicators.
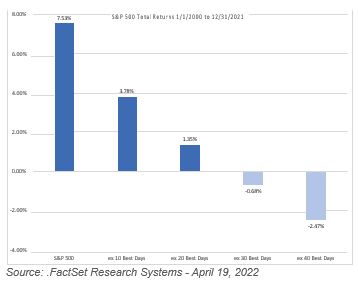
As for the latter question, “when?”- this is all that matters and is least clear. The biggest risk to market timing is not only cashing out correctly but most importantly when and how you get back in. It’s this decision to reinvest that has been demonstrated most problematic by study after study. Much of the markets’ alpha can be traced back to very few days and missing them has very real and compounding effects. The bar chart shows annualized returns for scenarios in which the top n days of the market are missed. This is undoubtedly cliche, but time is a far better ally than timing.
All of this is to say, be sure you are asking the correct questions. There will be another recession at some point. Were the timing predictable, the market would fully reflect this. The answers are moot. Given the well demonstrated futility in market timing, the real questions to ponder have to do with risk and investment goals. It’s important to develop a strategy that allows you to stomach whatever volatility may come our way. We know a market without volatility is one where little alpha can be generated so finding the right balance is key between risk tolerance and return where you can stomach the ebbs and flows with reasonable comfort. No amount of risk is worth forcing you into cash in a moment of panic as decisions motivated by fear rarely lead to good long-term outcomes. In looking at historical S&P 500 returns, we find that if an investor were out of the market for the S&P 500’s 10 best days, total returns would be significantly lower than the return for investors who stayed invested.
We are keenly focused on anticipating any major shifts in leadership as these changes often persist for entire cycles. There are many positive and negative consumer cross currents. Consumers have cash and savings but have been burning through them at a blistering pace. The benefit of a generous employment market may quickly fizzle if participants in those typically semi-permanent job categories are forced back to work by dwindling benefits and unforeseen tax implications of credits pulled forward. In addition to this are potentially increased taxes on investment portfolios and on ordinary income among the highest tax brackets. We make our portfolio positioning decisions based on the weight of the evidence. For now, that evidence is mixed, and we remain steadfast, vigilant, and protective.
FIRST QUARTER 2022 REVIEW
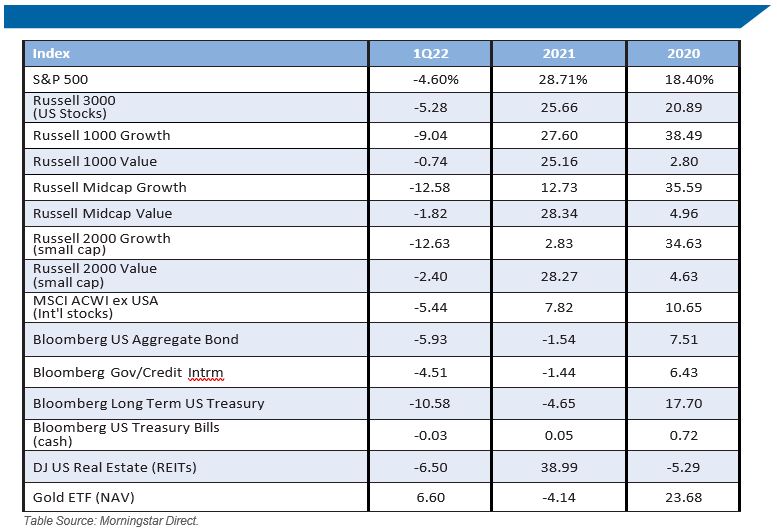
The United States equity market, as broadly measured by the Russell 3000 Index, declined -5.3% in the first quarter of the year. Notable strong performance came from the energy sector, which, as measured by the S&P Select Services Index family, returned +39.1% over the period. Russia/Ukraine tension led to higher inflation and supply shocks across commodities contributing to historical surges in oil prices. Utilities, the only other sector with positive performance over the quarter, gained +4.8%. All the other sectors posted negative returns for the quarter, Communication Services led to the downside, losing -11.3%. Followed by Consumer Discretionary (-9.4%), Technology (-8.5%), and Real Estate (-6.2%). Growth was the clear loser across all market caps, as it greatly underperformed its value counterparts. The greatest dispersion between style class was seen in Mid Cap, where Russell Mid Cap Growth declined -12.6% and Russell Mid Cap Value decreased by only -1.8%. That said, Russell 1000 Value was the top performing US equity asset class for the quarter declining only -0.74%. Contrastingly, Small Cap Growth, as measured by the Russell 2000 Growth, was the worst performer down -12.63% this year. International markets continued to be weak with the MSCI All Country World Index ex USA declining -5.4%. Gold, as measured by SPDR Gold Shares, saw positive performance amid rising inflation, gaining +6.6% year to date.
Analysts and companies have become more pessimistic in their earnings outlooks and revisions, consequently earnings estimates are lower today than at the beginning of the quarter. The first quarter earnings growth rate for the S&P 500 is estimated to be 5.1%. If this is the actual growth rate, it would mark the lowest earnings growth rate since Q4 2020. Although historically, actual earnings reported exceed estimated earnings on average by +8.9% as companies typically report positive surprises. Thus far, 7% of S&P 500 companies have reported earnings for the first quarter. Of these companies, 77% have beat on EPS, and 80% have delivered higher revenues than estimated. Out of the companies to report so far, labor cost and shortages have been cited as major headwinds. While Ukraine has also been cited on earnings calls, only a small number of companies specified it would have a negative impact on business. We look to company commentary for insight into the impact of ongoing fundamental concerns.
GLOBALT is an SEC Registered Investment Adviser since 1991 and, effective July 10, 2013, remains a Registered Investment Adviser through a separately identifiable division of Synovus Trust N.A., a nationally chartered trust company. GLOBALT provides professional money management to both institutional and individual investors through Equity, Fixed Income, and ETF Asset Allocation strategies. Registration of an Investment Adviser does not imply any certain level of skill or training.
Valuations in this report are based on information provided by third party sources. Although the data gathered from third-party sources is believed to be reliable, GLOBALT Investments has not audited or verified the accuracy or completeness of the information. GLOBALT is not responsible for any damages or losses arising from any use of third- party data. Any security, allocation, or weightings described herein are subject to change without notice and no assurances are made that they will remain in a strategy or portfolio at the time you receive this information. Illustrative strategies or portfolios shown may not be representative of strategies or portfolios of existing clients. Performance numbers shown are subject to change without notice. If there are any questions regarding this report, please contact your Advisor or GLOBALT for assistance.
The performance data presented represents past performance, which do not guarantee future performance and future performance may result in a loss. No current or prospective client should assume that the future performance of any specific investment, investment strategy (including the investments and/or investment strategies recommended/offered by the Adviser or GLOBALT) or product referenced will be profitable or equal to past performance levels. The investment return and principal value of an investment will fluctuate, thus when sold or redeemed, may be worth more or less than the original cost. There are risks, including possible loss of principal, associated with investing in securities, including but not limited to erratic or volatile market conditions, financial and debt market risk, geopolitical risk, management risk, liquidity, non-diversification risk, credit and counterparty risk. Diversification and/or strategic asset allocation do not guarantee a profit nor protect against a loss in declining markets. Investors should carefully consider investment objectives, risks, charges and expenses. Clients are advised that their statements and individual trade confirmations, not this report, are the official records of their accounts and transactions. This and other important information are contained in GLOBALT’s Form ADV Part 2 and Part 3, which is provided by your Advisor and should be read carefully prior to investing. Report calculations and figures should not be relied upon for tax purposes. The information herein is not a substitute for professional tax advice. You should consult your tax advisor for specific questions regarding your own tax situation.
Indexes are unmanaged and it is not possible to invest directly in an index. Index returns shown do not represent the results of actual trading of investor assets. Index returns do not reflect payments of any sales charges, fees, or expenses that an investor would pay or incur to purchase or own the securities that indices represent. The imposition of such fees, charges or expenses would cause actual and back-tested performance to be lower than the performance shown for that index. Exposure to an asset class represented by an index may be available through investable instruments based on that index. There is no assurance such investment products will accurately track index performance or provide positive investment returns.
GLOBALT claims compliance with the Global Investment Performance Standards (GIPS®).
GLOBALT has prepared this material for informational purposes only. It should not be construed as investment advice, a recommendation or solicitation to purchase and / or
sell any security.
Content may not be reproduced, distributed, or transmitted in whole or in part, by any means without written permission from GLOBALT. To receive permission or obtain a copy of GLOBALT’s Form ADV Part 2 and Part 3, contact GLOBALT’s Chief Compliance Officer, 3400 Overton Park Drive, Suite 200, Atlanta GA 30339. You can obtain additional information about GLOBALT Investments and its Advisors by accessing IAPD (Investment Adviser Public Disclosure).
NOT A DEPOSIT. NOT FDIC INSURED. NOT GUARANTEED BY THE BANK. MAY LOSE VALUE. NOT INSURED BY ANY FEDERAL AGENCY