

By Gary Stringer, Kim Escue and Chad Keller, Stringer Asset Management
The global markets experienced a remarkable second quarter rebound in both the equity and credit markets. The U.S. Federal Reserve’s (Fed) decisive and effective actions quickly calmed the liquidity crunch we saw in March by providing liquidity to markets and propelling averages to what we are projecting to be pre-pandemic market levels. The resilience of the U.S. economy and the effectiveness of the Fed’s actions that fueled the initial rebound phase have strengthened our outlook and increased the probability of a quick turnaround and end to the current recession in our opinion.
In fact, our work suggests that the rebound in the credit and equity markets is telling us that the U.S. economy will quickly return to expansion. Historically, the equity market bottoms three to four months before the economy resumes a new expansionary phase. The market bottom in late March supports our thesis that we will again see economic growth potentially as early as this summer, making the current recession the shortest in U.S. history dating back to 1854.
Equity and credit market movements are only part of the story. Industrial metals prices, which are a proxy for global economic growth, and market-based inflation expectations are also trending higher. This suggests that the prospects for a return to economic growth have improved. However, the level of these indicators suggests that growth going forward will be subdued.

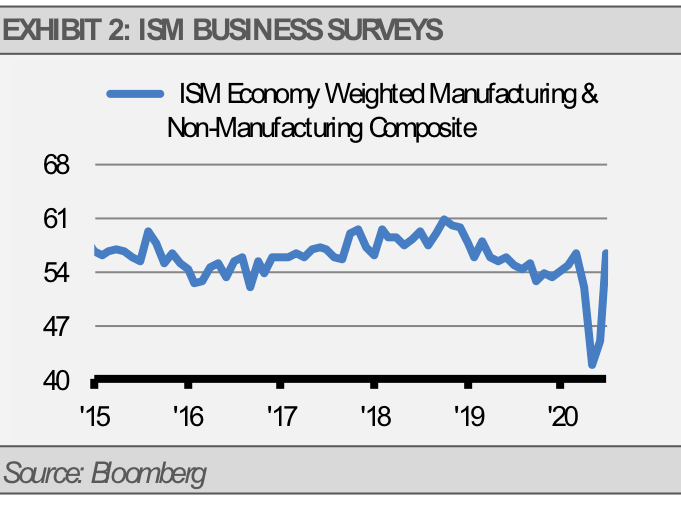
Similarly, business survey data, such as purchasing manager indices (PMIs), have rebounded sharply, as forecasted by the recovery in the previously discussed indicators.
The economic recovery is likely to start out looking like a V-shaped recovery on a quarter-over-quarter percentage change basis. We expect second quarter GDP to have dropped by roughly 10% and be followed by a rebound in the third and fourth quarters. In actual dollar terms, the economic decline and rebound will look more drawn out. It may take a couple of years for our economy to grow to the level that we would have been without the crisis, although markets can continue to move higher as forward-looking indicators of growth and recovery.

Still, investors should be prepared for more volatility and ugly headlines. The third quarter tends to be a difficult period for U.S. equity markets, especially with the pandemic providing no shortage of headline risk along with typically backward-looking economic reports.
For example, second quarter earnings expectations have fallen by the largest amount in history according to FactSet and the pace of second quarter earnings reported will increase during the second half of July. Furthermore, the Q2 GDP report will likely show the fastest pace of economic decline in U.S. history when the initial report is published on July 30th. However, the U.S. economy is likely to be growing again by the time these reports are published. We already know that the impact of the economic shutdown is unprecedented, but the release of this information will make headlines and unnerve investors.
It will be important for investors to focus on leading indicators rather than lagging indicators and headline noise. Over the long-term, markets are driven by the prospects for growth, though near-term noise can certainly overshadow both weak and strong fundamentals. To reiterate the point that we made at the end of March:
Economic recessions, except those involving a banking crisis, and the associated recoveries tend to be V-shaped. The current recession will likely also be V-shaped once the virus crisis passes. Once restrictions begin to be lifted, we can expect to see a strong resumption of economic growth. Still, it will be important to be focused on areas that are most likely to participate fully and shy away from areas that are likely to continue to struggle. Tactical choices will be important.
Our current base case scenario is that the stock market appreciates impressively over the next year, although we may see some consolidation in the near-term as we think the market got ahead of itself during the second quarter.
On the fixed income side, we expect the 10-year Treasury yield to move up to approximately 1.25% as the economy recovers. Additionally, we expect credit spreads to continue tightening, which should offer some relief from rising long-term interest rates.
In our experience, consensus earnings expectations are relatively inaccurate around turns in the business cycle as forward estimates are often too high at the business cycle peak and too low at the bottom. We believe that the brevity of the current recession means that we are nearing an economic upturn and consensus earnings expectations for the next 12 months are now too low. Corporate operating earnings will likely revert to trend over the coming quarters as economic growth stabilizes closer to its long-term trend.

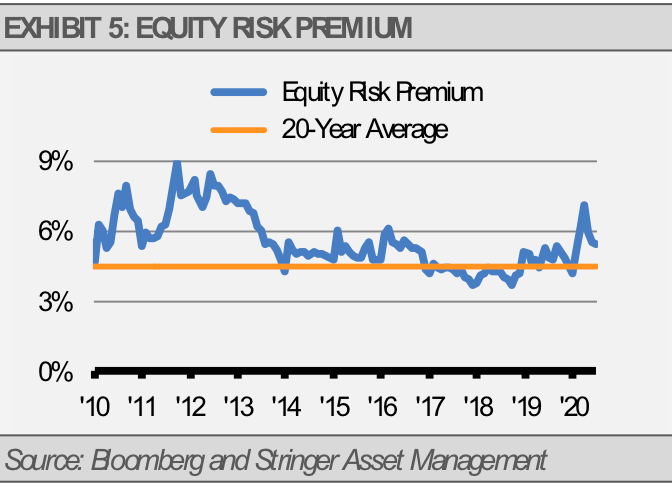
Furthermore, overall equity market valuations do not look stretched in our view despite the recent impressive recovery. Based on the current level of the S&P 500 Index’s equity risk premium, which is the difference between the earnings yield for stocks and the 10-year Treasury yield, equities are still priced relatively attractively.
While we are not out of the woods yet and the economy will likely take more than a year to fully recover, we expect to see further recovery in credit spreads with the U.S. equity market making new all-time highs within the next 12 months or less.
Still, we acknowledge the great uncertainties arising as a result of government and private sector responses to the pandemic. We view this as the greatest risk to our base-case forecast. To further clarify, professional investors use statistics like standard deviation to attempt to quantify portfolio risk. However, the government and private sector responses to this global pandemic are unprecedented and the uncertainties stemming from the situation are not really quantifiable. As a result, we think it is prudent to not make large strategic allocation shifts. Instead, we think investors should seek tactical opportunities when and where they present themselves.
INVESTMENT IMPLICATIONS
For the time being, we are maintaining our broad strategic allocations with overweights to domestic equities while investing in high quality fixed income and alternative investments to help manage risk. We are tactically looking for opportunities to find attractive valuations and themes, and to pare back risk as necessary.
Currently, our largest sector allocations include health care, information technology, and industrials. Within fixed income, we favor mortgage backed securities and corporate bonds. Our alternative allocations include non-traditional active fixed income, convertible bonds, preferreds, and an equity put writing strategy.
We are watching our indicators closely and will make adjustments quickly if we sense problems or other opportunities ahead. That flexibility is one of the benefits of having a tactical allocation where we can manage risk in real time.
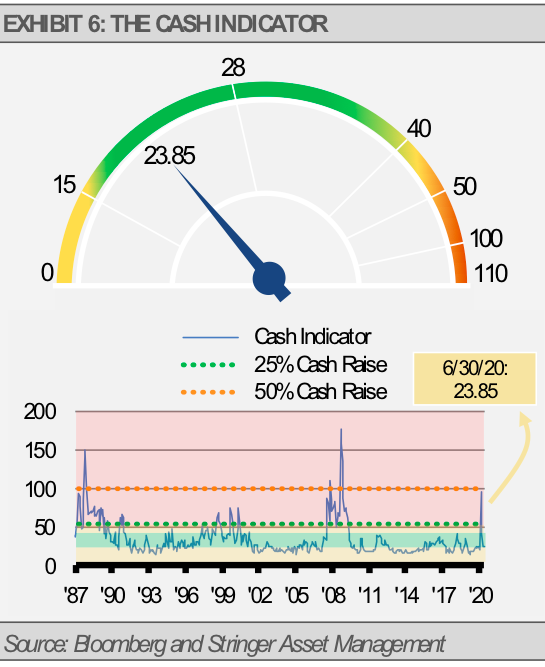
THE CASH INDICATOR
Our Cash Indicator (CI) has steadily edged lower. The current level suggests that the markets are functioning better with sufficient liquidity, yet not too much complacency. Keep in mind that the CI, as a statistical measure, is bound by reversion to the mean and can signal volatility based on extremely high or low levels.
DISCLOSURES
Any forecasts, figures, opinions or investment techniques and strategies explained are Stringer Asset Management, LLC’s as of the date of publication. They are considered to be accurate at the time of writing, but no warranty of accuracy is given and no liability in respect to error or omission is accepted. They are subject to change without reference or notification. The views contained herein are not to be taken as advice or a recommendation to buy or sell any investment and the material should not be relied upon as containing sufficient information to support an investment decision. It should be noted that the value of investments and the income from them may fluctuate in accordance with market conditions and taxation agreements and investors may not get back the full amount invested.
Past performance and yield may not be a reliable guide to future performance. Current performance may be higher or lower than the performance quoted.
The securities identified and described may not represent all of the securities purchased, sold or recommended for client accounts. The reader should not assume that an investment in the securities identified was or will be profitable.
Data is provided by various sources and prepared by Stringer Asset Management, LLC and has not been verified or audited by an independent accountant.
Index Definitions:
S&P 500 Index – This Index is a capitalization-weighted index of 500 stocks. The Index is designed to measure performance of a broad domestic economy through changes in the aggregate market value of 500 stocks representing all major industries.