

By Kevin Nicholson, Chris Konstantinos, Doug Sandler, Rebecca Felton, Rob Glownia and Rod Smyth, RiverFront Investment Management
Since the founding of RiverFront in 2008, we have adhered to three tactical rules — Don’t Fight the Fed, Don’t Fight the Trend, and Beware the Crowd at Extremes. In the early years, we reviewed the three rules qualitatively.
More recently, we quantified the latter two rules to help counteract emotional biases and enhance our tactical decision-making.
In our opinion, it is important to look through both qualitative and the quantitative lenses, but for the purpose of this piece, we will focus mostly on the qualitative analysis. The following is an update on the recent status of each of the rules and how they align with our current investment thesis.
1. Don’t Fight the Fed: Slightly Bullish
2. Don’t Fight the Trend: Neutral
3. Beware of the Crowd at Extremes: Extremely Optimistic
DON’T FIGHT THE FED
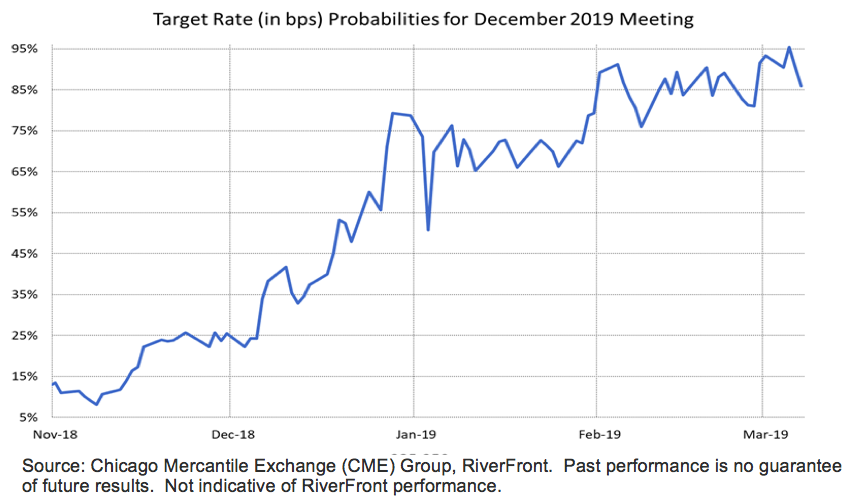
The Federal Reserve paused its rate hiking campaign in January as US economic growth began to show signs of slowing late last year. Since the January monetary policy shift, the Fed’s dovish commentary has changed investor sentiment from bearish to bullish, subsequently propelling the S&P 500 from a low of 2350 to around 2800 currently. The policy decision to pause has moved the Fed from being bearish to neutral, in our view. Furthermore, the Fed has said it will soon stop shrinking its balance sheet (i.e., quantitative tightening) and potentially accept inflation levels above its strict 2% inflation target. The chart below shows the probability of the Fed funds rate being unchanged through December 2019, indicating that the Fed is on investors’ side. Investors are no longer fighting the Fed as they were three months ago, as financial conditions have eased, creating an opportunity to benefit from a lower interest rate environment than originally anticipated at the beginning of the year. Thus, our assessment of Fed policy changes from neutral to slightly bullish.
DON’T FIGHT THE TREND
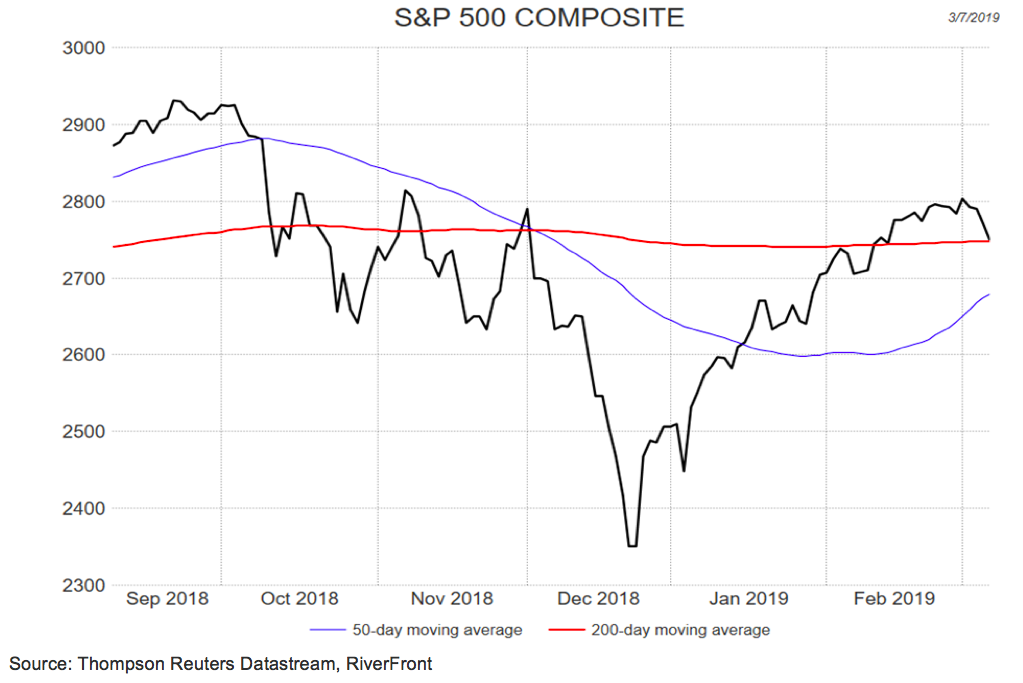
The trend, which we define as the S&P 500’s 200-day moving average (the red line in the chart below), has flattened since the S&P 500’s high of 2940 in September 2018. Over the last six months, the S&P 500 has been mostly range-bound, trading between 2640 and 2800. The current trend reflects decelerating momentum as investors re-evaluate slowing economic growth and its impact on corporate earnings growth and subsequent capital expenditures. The trend is currently at a crossroad: if it turns positive, the odds for a positive return over the next three months improve above the long-term average when combined with current sentiment levels. However, a decidedly negative turn on the trend would drop the odds below the long-term average, warranting caution (based on the research from our quantitative process). Therefore, we rate the trend overall as neutral.
BEWARE OF THE CROWD AT EXTREMES
As we have written over the years, investors’ fear of “missing out” tends to drive many investors into the market following periods of strong positive returns, such as those experienced by the S&P 500 since the Christmas Eve low. Conversely, fears of negative returns in a down market can make investors overly bearish, thus causing them to miss out on attractive investment opportunities. We use the Ned Davis Research (NDR) Crowd Sentiment Poll to help gauge whether the “crowd” has reached optimistic or pessimistic extremes. NDR’s sentiment poll is currently in “extreme optimism” territory, suggesting that we should be more cautious going forward. Extreme optimism generally resolves itself in one of two ways: either a steep market drop makes investors less optimistic, or a market consolidation moves sideways until the condition fades. We believe that the latter is more likely, as we expect the S&P 500 to remain range bound. We have found judging the “crowd” to be important; however, in looking deeper into the historical probabilities around crowd sentiment signals, we have refined how we use this condition. Using our quantitative processes, when we combine the trend and sentiment readings, the current outcome gives us a much more neutral outlook, suggesting that judging the crowd at extremes in isolation can be misleading. For instance, when extreme optimism is combined with a positive trend, markets can continue to grind higher. Currently, we believe the market will be range-bound, and we will look for pullbacks as a buying opportunity to put any excess cash into stocks.

Past performance is no guarantee of future results. © 2019 Ned Davis Research Inc. Further distribution prohibited without prior permission. All Rights Reserved. See NDR Disclaimer at www.ndr.com/copyright.html. For data disclaimers refer to www.ndr.com/vendorinfo/
THE FINAL VERDICT
The Fed pause has created a positive backdrop for equity performance, in our opinion. We view the flat trend and the extreme optimism of the crowd as cautionary in the near term. The conditions for our three tactical rules have improved as the fundamentals have risen from negative to neutral. However, until our tactical indicators move from neutral to positive, we believe that it is appropriate to be slightly overweight equities given the low probability of a recession and reasonable valuation levels.
Important Disclosure Information
The comments above refer generally to financial markets and not RiverFront portfolios or any related performance. Past results are no guarantee of future results and no representation is made that a client will or is likely to achieve positive returns, avoid losses, or experience returns similar to those shown or experienced in the past.
Information or data shown or used in this material is for illustrative purposes only and was received from sources believed to be reliable, but accuracy is not guaranteed.
CME Group, Fed Watch Tool’s Assumptions and Interpretations (for more information, please visit: https://www.cmegroup.com/trading/interest-rates/countdown-to-fomc.html:
- Probability of a rate hike is calculated by adding the probabilities of all target rate levels above the current target rate.
- Probabilities of possible Fed Funds target rates are based on Fed Fund futures contract prices assuming that the rate hike is 0.25% (25 basis points) and that the Fed Funds Effective Rate (FFER) will react by a like amount.
- Federal Open Market Committee (FOMC) meetings probabilities are determined from the corresponding CME Group Fed Fund futures contracts.
Fed fund futures are a cash settled instrument based on the average daily effective Fed funds rate (published by the New York Fed) over the course of the contract delivery month.
In a rising interest rate environment, the value of fixed-income securities generally declines.
It is not possible to invest directly in an index.
Technical analysis is based on the study of historical price movements and past trend patterns. There are no assurances that movements or trends can or will be duplicated in the future.
Stocks represent partial ownership of a corporation. If the corporation does well, its value increases, and investors share in the appreciation. However, if it goes bankrupt, or performs poorly, investors can lose their entire initial investment (i.e., the stock price can go to zero). Bonds represent a loan made by an investor to a corporation or government. As such, the investor gets a guaranteed interest rate for a specific period of time and expects to get their original investment back at the end of that time period, along with the interest earned. Investment risk is repayment of the principal (amount invested). In the event of a bankruptcy or other corporate disruption, bonds are senior to stocks. Investors should be aware of these differences prior to investing.
Standard & Poor’s (S&P) 500 Index measures the performance of 500 large cap stocks, which together represent about 80% of the total US equities market.
RiverFront Investment Group, LLC, is an investment adviser registered with the Securities Exchange Commission under the Investment Advisers Act of 1940. The company manages a variety of portfolios utilizing stocks, bonds, and exchange-traded funds (ETFs). RiverFront also serves as sub-advisor to a series of mutual funds and ETFs. Opinions expressed are current as of the date shown and are subject to change. They are not intended as investment recommendations.
RiverFront is owned primarily by its employees through RiverFront Investment Holding Group, LLC, the holding company for RiverFront. Baird Financial Corporation (BFC) is a minority owner of RiverFront Investment Holding Group, LLC and therefore an indirect owner of RiverFront. BFC is the parent company of Robert W. Baird & Co. Incorporated (“Baird”), a registered broker/dealer and investment adviser.
Copyright ©2019 RiverFront Investment Group. All Rights Reserved. 772361