

By Gary Stringer, Kim Escue and Chad Keller, Stringer Asset Management
While the U.S. stock market is nearing all-time highs, some of our favored economic indicators have weakened. Their weakening suggests sluggish economic growth ahead and their deterioration will likely make equity markets more vulnerable. As a result, we have recently moved to further increase the defensive nature of our Strategies.
We manage risk at three levels within our Strategies. First, we manage risk within our strategic, long-term allocations based on diversification across low-correlated assets and a focus on areas where we find more attractive relative values. Secondly, we manage risk tactically over the short-term by investing across a broad array of themes and asset classes including cash. Lastly, our proprietary Cash Indicator methodology acts as a plan in case of an emergency. This approach is analogous to the multiple safety systems in a modern automobile, which includes an airbag. Each of these systems work together to potentially help smooth the ride for our investors.
Within our strategic allocations, we have increased our exposure to domestic equities that tend to exhibit lower volatility and more consistency yet are generally not sensitive to interest rate changes. Tactically, we eliminated pro-cyclical positions, such as technology and consumer discretionary, in favor of low volatility equity and cash or high-quality fixed income depending on the Strategy. We also continue to favor tactical allocations to the health care sector.
A combination of softening data coming from the following areas fed into our recent positioning decisions:
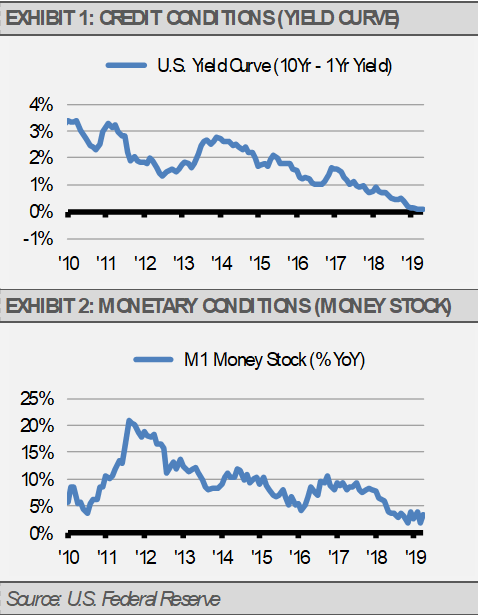
Credit Conditions: a flat-to-inverted yield curve (10-year Treasury vs. 1-year Treasury);
Monetary Conditions: liquidity growth (M1) slowing significantly; and
Survey Data: the JPMorgan Global PMI Composite for May showed the slowest global economic growth since June 2016 and the lowest level of business confidence since that data set began in 2012.
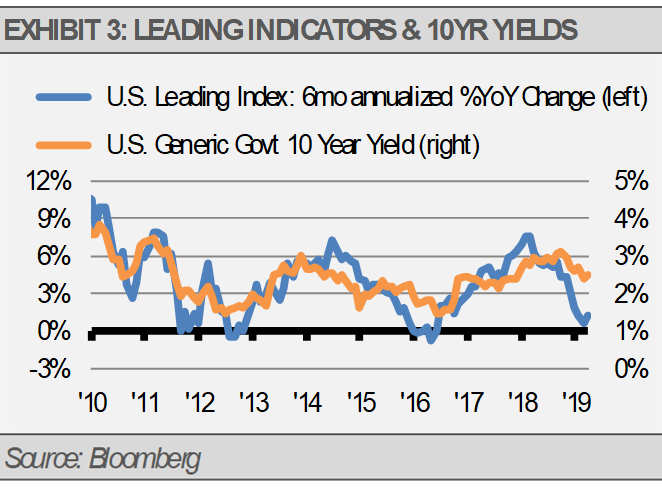
We think that it is the recent loss of economic momentum that has contributed to lower long-term rates. For example, consider the relationship between the Conference Board Index of Leading Economic Indicators (LEIs) and the 10-Year Treasury yield. As illustrated below, the rate of expected economic growth, as measured by LEIs, and long-term bond yields tend to move together. We think that for long-term yields to move significantly higher, we would need to see a faster pace of economic growth.
The employment report for May confirms the loss of economic momentum. The May employment report showed not only a lack-luster 75,000 new jobs were created, but downward revisions to the March and April reports as well. These revisions showed 75,000 fewer jobs were created than initially reported for those two months. As a result of this slowing jobs growth, the U.S. has averaged 164,000 new jobs per month in 2019 compared to 223,000 new jobs in 2018 according to the Bureau of Labor Statistics. Note that the U.S. labor force grows by approximately 100,000 new workers per month, so jobs creation in the U.S. is still healthy in our view.
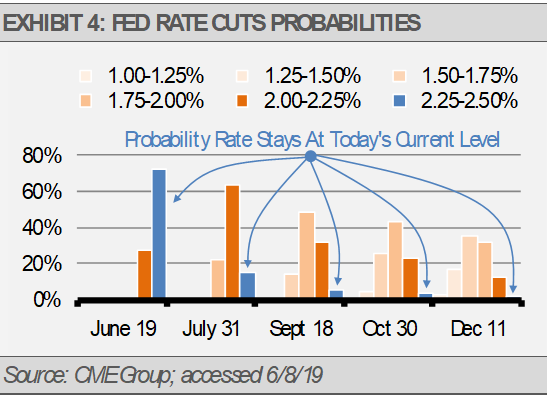
We think that the U.S. Federal Reserve (the Fed) will begin to reduce short-term interest rates in response to the weaker economic growth. However, we are concerned that the Fed will not act soon enough or forcefully enough to avert further economic deterioration. The market, according to the CME FedWatch Tool, is pricing in only a 27% probability of a rate reduction at the Fed’s June 19th meeting, but at 85% probability of a reduction at the conclusion of the Fed’s July 31st meeting. Looking out to the December 11th meeting, the market is pricing in a 98.5% probability of at least one cut and an 86.4% probability of multiple cuts throughout the year. Still, we think that the Fed has been too slow to acknowledge the loss of economic momentum, which leaves the economy and markets more vulnerable than they otherwise would be.
Though we have positioned our Strategies somewhat more cautiously, we expect global economic growth to continue along with higher equity prices, subject to bouts of volatility. Our longer-term view of U.S. economic fundamentals remains positive based on a growing labor force, positive productivity trends, and a lack of inflationary pressure.
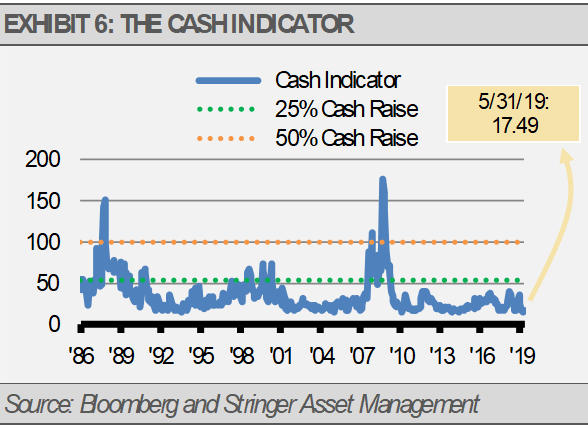
THE CASH INDICATOR
The Cash Indicator (CI) continues to hover near historic lows, which suggests to us that the markets may be too complacent, especially with the backdrop of sluggish economic growth. While the CI suggests that we are far from a crisis, we should expect an uptick in volatility. In our experience, it is only a matter of time before the markets find some reason to panic. Still, the increased volatility that we expect is likely not a sign of a crisis.
This article was written by Gary Stringer, CIO, Kim Escue, Senior Portfolio Manager, and Chad Keller, COO and CCO at Stringer Asset Management, a participant in the ETF Strategist Channel.
DISCLOSURES
Any forecasts, figures, opinions or investment techniques and strategies explained are Stringer Asset Management, LLC’s as of the date of publication. They are considered to be accurate at the time of writing, but no warranty of accuracy is given and no liability in respect to error or omission is accepted. They are subject to change without reference or notification. The views contained herein are not be taken as an advice or a recommendation to buy or sell any investment and the material should not be relied upon as containing sufficient information to support an investment decision. It should be noted that the value of investments and the income from them may fluctuate in accordance with market conditions and taxation agreements and investors may not get back the full amount invested.
Past performance and yield may not be a reliable guide to future performance. Current performance may be higher or lower than the performance quoted.
The securities identified and described may not represent all of the securities purchased, sold or recommended for client accounts. The reader should not assume that an investment in the securities identified was or will be profitable.
Data is provided by various sources and prepared by Stringer Asset Management, LLC and has not been verified or audited by an independent accountant.
Index Definitions:
S&P 500 Index – This Index is a capitalization-weighted index of 500 stocks. The Index is designed to measure performance of a broad domestic economy through changes in the aggregate market value of 500 stocks representing all major industries.