

More seasoned areas of the active ETF space have seen better results. Fixed income generally has lower expenses, and several large asset managers launched active ETFs as far back as 2008, giving us a better read on performance.
![]()
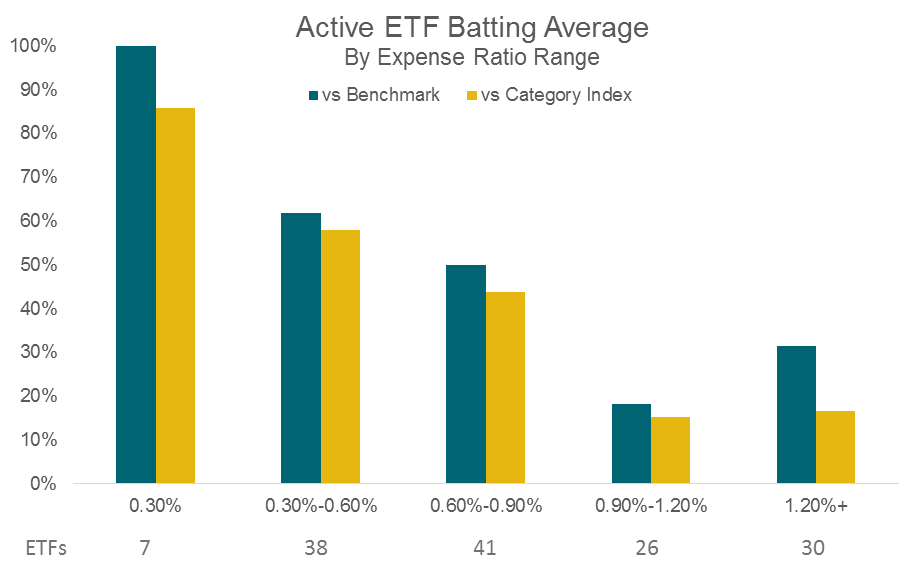
Source: Morningstar. Prospectus Gross Expense ratios used. Fund and Index performance is from the listed inception date of the ETF. Active ETFs used have at least 1 year of live performance history.
Fixed income launches in the active space haven’t really slowed, but we have seen a pickup in sector-specific strategies. This is another category that has done relatively well versus benchmarks, and it makes sense – If a firm launches an active ETF, it should do so in a niche area where it has expertise.
Related: 3 ETF Easter Eggs: ARKK, YYY, QXTR
This analysis is nowhere near perfect. There hasn’t been enough time to evaluate active managers, there haven’t been enough ETFs to judge performance in the aggregate, and there are a number of nuances with what is labeled active (is the manager completely rules-based but filed as active? Is the active component just selecting commodity curve positioning?) However, careful due diligence in the active space can lead to strong results for clients. As the environment for active management appears to be changing, the extra work to select low-cost active managers in the tax-friendly ETF wrapper can yield strong results for investors in the months and years to come.
Grant Engelbart, CFA, CAIA, is a Portfolio Manager at CLS Investments, a participant in the ETF Strategist Channel.
Disclosure Information
This information is prepared for general information only. Information contained herein is derived from sources we believe to be reliable, however, we do not represent that this information is complete or accurate and it should not be relied upon as such. All opinions expressed herein are subject to change without notice. The graphs and charts contained in this work are for informational purposes only. No graph or chart should be regarded as a guide to investing.