Rank Transform
The rank transform replaces values with their ascending ranks (from 1 to N), preserving the order of the dispersion information, but eliminating any relative scale. In our specific example, this transform reflects the view that the rank order of performance is predictive, but the amount of relative outperformance between securities is not.
Rank & Bin Transform
The bin transform places data into (generally) equally-spaced bins and ranks the bins (from 1 to the number of bins), maintaining some “broad-strokes” information about relative dispersion, but eliminating information about dispersion within bins.
Rank & Step Transform
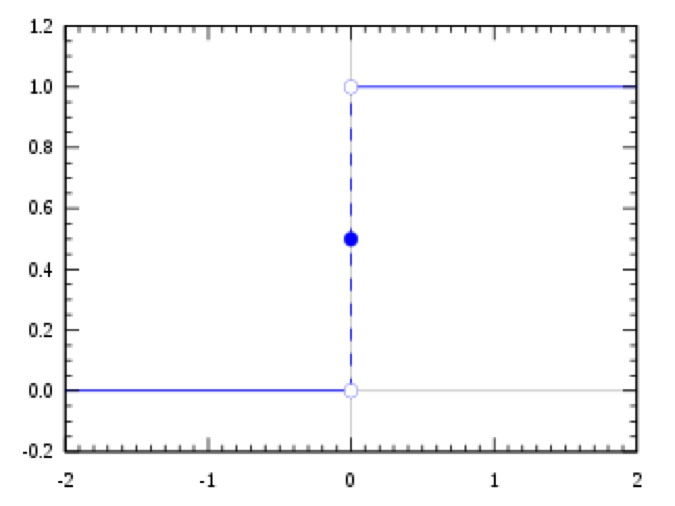
The step transform can be seen as a filter. After rank ordering the estimates, those below a certain rank are zeroed out while those above are given an equal non-zero value (e.g. 1). This has the effect of eliminating dispersion information as well as relative rank beyond the threshold level.
Under our optimization framework, “top N” momentum strategies (those that rank securities, choose the top N, and equally weight them) can be formulated as a mean-variance optimal portfolio with active views on returns, volatilities, and correlations where a step transform is applied to prior returns, and both volatilities and correlations are identical across securities.

It should be noted that several transforms can also be chained together. For example, a bin transform taken on its own may lead to a large number of data points being clustered in the same bin depending upon the dispersion of the data. By first taking a rank transform, the bin transform will preserve relative rank information across different percentiles of the data.
Transformers, Roll Out
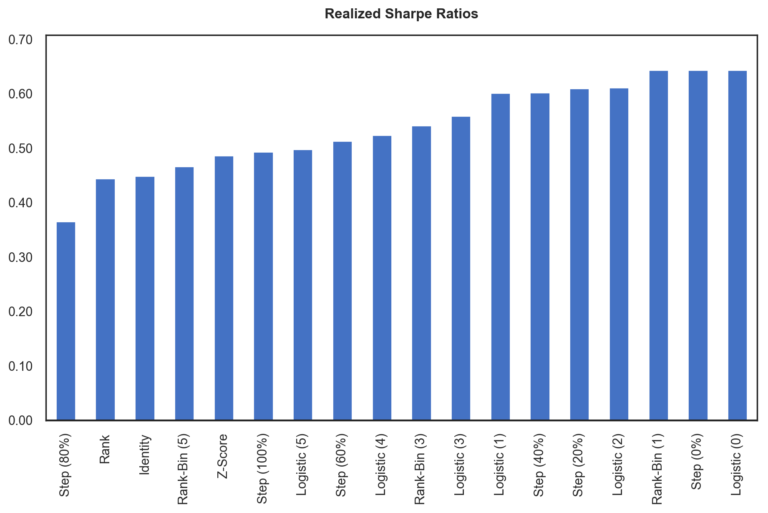
To explore the impact of these different transformations, we apply them to our calculated expected returns and use the result as the input to our mean-variance optimization. For each different variation, we then calculate the full-period realized Sharpe ratio. Below, we plot the Sharpe ratios in sorted order.

For relevant transforms, labels are accompanied by their parameterization. For clarification:
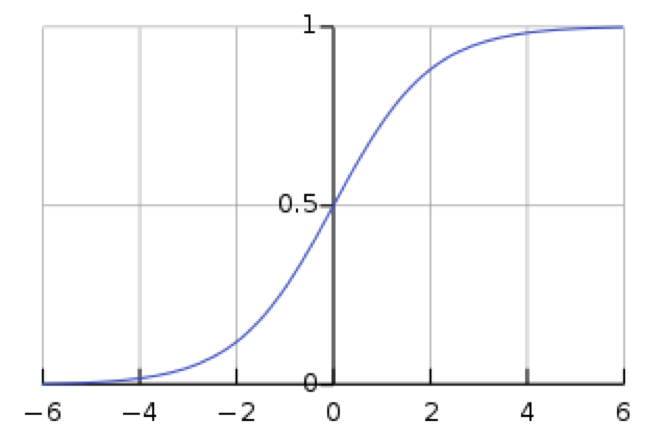
- Parameterization of the logistic transform specifies the growth parameter.
- Parameterization of the rank-bin transform specifies the number of bins employed.
- Parameterization of the step transform specifies the percentile cutoff.
It would appear, at first glance, that applying these transforms may be able to make significant improvements in risk-adjusted returns.
As we look closer, though, we see something rather curious: the methods at the far right seem to be dominated by the fact that they almost entirely eliminate information about both dispersion (including rank and relative scale). A single ranked bin, a step function at the 0thpercentile, and a logistic function with a growth parameter of zero all effectively apply the same transform: returns become identical, taking on any value.
Per the decision tree above, if all returns are identical, then the mean-variance optimization basically becomes a minimum-variance optimization.
In fact, it seems that the more specific information we eliminate about returns, the better the Sharpe ratio gets. Does this imply that, for the test at hand, to maximize our out-of-sample Sharpe ratio we are better off eliminating information about returns? Does this mean that momentum does not matter for risk-adjusted returns?
Not so fast. We should remember that these Sharpe ratios are themselves estimates and, therefore, are shrouded in their own probability distribution. If we actually perform the tests required to determine whether differences in Sharpe ratios are statistically significant, we find that they are not.
Let us repeat that again: none of the Sharpe ratios are statistically distinguishable from one another. We cannot reject, with any meaningful confidence, that these results are not entirely due to randomness. The realized outperformance of the minimum variance approach could reflect a superior investment process or be due entirely to luck.
At first this may seem depressing or frustrating. We would argue it is enlightening. If the backtested dispersion between these results is high, but they are statistically indistinguishable, then we have found yet another place where diversification can work its magic!
By choosing a single transform and parametrization, we risk selecting the wrong specification. Had we started with the belief that rank and dispersion information is useful and applied no transform, we would have had one of the worst possible realized Sharpe ratios. However, the future may unfold quite differently. Based on the chart above, we could choose to completely forgo the rank and dispersion information only to find that it holds quite a bit of meaningful information going forward.
The wonderful thing about diversification is that it allows us to fully admit our ignorance of the future and build an approach that is robust to all potential outcomes. By taking an ensemble approach – building portfolios for each transform and then averaging the results – we end up with a realized Sharpe ratio that approaches the average and, our research suggests, often even exceeds it.
Conclusion
Portfolio construction says just as much about our beliefs as it does our objective. The choice of mean-variance versus risk-parity versus equal-weight is not just a technical decision: it is one founded deeply in our beliefs about return, volatility, and correlation.
In practice, we must also consider the strength of our beliefs. We may hold active views on returns, volatilities, and correlations, but may not have much confidence in our ability to quantify them. This confidence can be addressed through approaches such as shrinkage, Black-Litterman or Entropy Pooling, or we can address them by transforming our data.
Common transformations will attempt to retain the salient features of the data while reducing the potentially harmful impact of estimation error. In the example explored in this commentary – a simple sector rotation strategy – we applied transformations to our expected returns, which were derived from prior returns. The salient features of the data were the level and dispersion of the returns.
Each transform utilized retained different amounts of information about these features. Over the backtest, we found that the transforms that eliminated the most information, effectively devolving the process into a minimum-variance optimization, had the highest backtested Sharpe ratios. At face value, this might suggest that information in returns is too noisy to be valuable for the process we employed. It is important to note, however, that none of the Sharpe ratios were distinguishable from a statistical perspective, meaning that the dominance of the minimum-variance approach may be merely due to randomness.
We believe that the important takeaway, once again, is that diversification is important. While we may believe that level and dispersion information embedded in prior returns is useful for portfolio construction, our test suggests that there may be sufficiently long periods where the signal is dominated by noise and future results may suffer. Just as with diversifying across asset classes, diversifying across transforms allows us to embrace the uncertainty of what the future holds.
Corey Hoffstein is the Co-founder & CIO at Newfound Research, a participant in the ETF Strategist Channel.

