
Markets and the news cycle have a funny relationship. As people, we always try to find patterns and relate events to grander movements within the stock markets. We saw an example of this occur last week, regarding the world’s number 1 soft drink, Coca-Cola.
The news headline on CBS reads like this: Soccer superstar Cristiano Ronaldo snubbed Coca-Cola. Then their market value sank $4 billion. Basically, Cristiano Ronaldo, who is one of the most popular global athletes, was doing a press conference at the Euro Championship event, which was sponsored by Coca-Cola. During the press conference, two Coke bottles were prominently featured on the table. Ronaldo removed those bottles and replaced them with a water bottle, insinuating for the audience to “drink more water.” Video below:
“Water!”: Portuguese soccer superstar Cristiano Ronaldo removed two bottles of Coca-Cola, which sponsors the Euro tournament, away from him as he entered a news conference on Monday before holding up a bottle of water to the media. pic.twitter.com/mfh8GDhseF
— CBS News (@CBSNews) June 15, 2021
Source: CBS News
The news report goes on to explain that this was costly to Coca-Cola, to the tune of about $4 billion in market capitalization. Now, $4 billion sounds like a large number, but in reality, that is less than a 2% stock price drop. You can see the drop highlighted in Coca-Cola’s (KO) chart below:
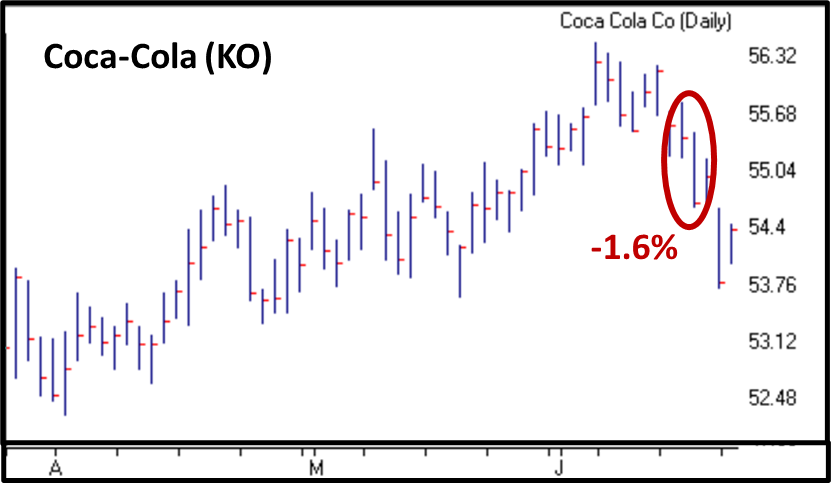
Source: Canterbury Investment Management; AIQ Trading Expert Pro
Did Ronaldo cost Coca-Cola $4 billion? The answer is no, he created some “market noise.” Market noise is defined as being a normal day-to-day fluctuation that has very little impact on the security’s overall movement. A more likely explanation for Coca-Cola’s drop can be found by examining its stock chart.
If we look at a chart of Coca-Cola, we can draw trend lines to establish where supply & demand of the stock shift. In other words, we can determine where the buyers have more power versus where the sellers take over. Heading into that press conference, Coke (KO) had just reached a new short-term high. That high matched up with a level of resistance. Think of it as the stock price had hit a ceiling and failed to break through, bouncing off and heading downward.
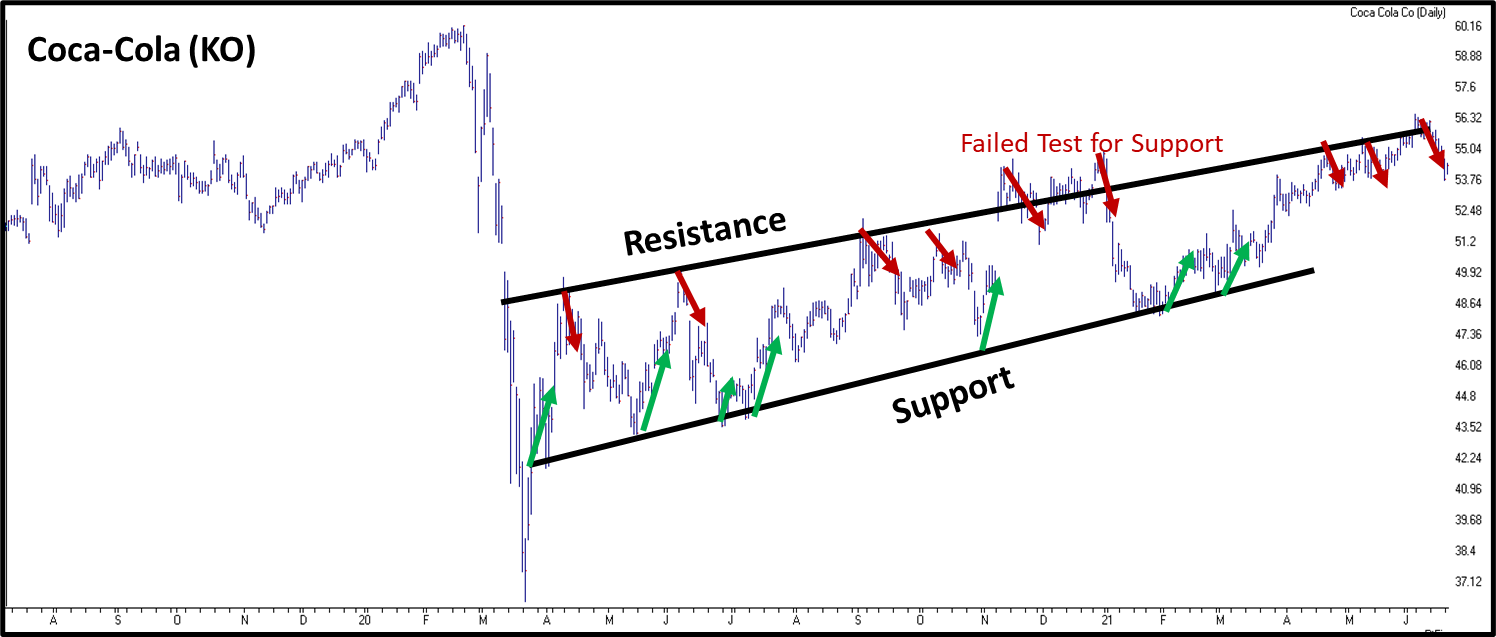
Source: Canterbury Investment Management; AIQ Trading Expert Pro
In the chart above, you can see two rising, basically parallel lines, forming what is called a channel. The lower line is labeled as “support” while the upper line is labeled as “resistance.” You can see each time that KO has hit that rising support line, it bounces off and heads higher. Each time it hits the rising resistance line, it bounces down and heads lower. One time, it broke above resistance, and tried to retest the line to determine if it would become a new support level, however that failed. These rising lines are where supply and demand shift. There are more buyers that jump in at the lower support line, while more sellers that liquidate their position at the rising resistance line.
Which approach sounds more logical? Did Ronaldo cause a stock price drop for Coca-Cola, or did the stock simply hit a wall of resistance? Maybe Ronaldo’s small action played a part in the timing of the price drop, but ultimately, the stock had hit a point where supply was stronger than demand and bounced off of that resistance line.
The bottom line is that the news does not drive the markets. In fact, you could examine this chart of Coca-Cola, know nothing about the company, and say there was a higher probability of a price drop than a price rise at that level. The news cycle does not tip the scale of the markets; investor’s actions do. Right now, Coca-Cola is in an upward sloping channel, trying to figure out which side it is going to break out of, regardless of the actions and comments of celebrities. Ronaldo does make a very good point though: be sure to drink more water!