

By Roman Chuyan, CFA
- It’s one of the most expensive markets of all time, while the economy is one of the worst ever.
- The market prices-in a quick, V-shaped recovery with certainty, forgetting about risk.
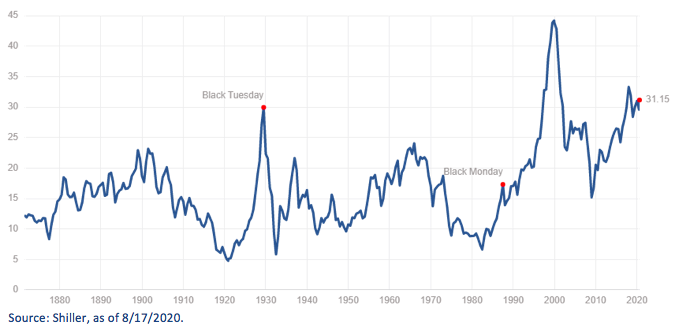
The stock market remains elevated, driven by Fed-induced liquidity and stimulus money funneled into stocks. At the same time, corporate earnings declined by around 34% in Q2 from the same quarter last year. These trends have brought valuation ratios to historical highs. In its 150-year history, Shiller’s cyclically-adjusted P/E ratio, now at 31, has only been higher in 2018 and in 1998-2002 (see chart). The 30% market plunge in the first quarter is but a blip on this chart. The valuation measure that we use in our equity model, the price-to-book ratio, is around 3.9, its highest since 2002.
The US economy shrank by 8.2% in Q2 (32.9% annualized, see chart below), and by 9.5% cumulatively in the first half of this year. This is almost double the 2008-09 Great Recession when US GDP contracted by a cumulative 5.1%, and the most severe recession in 75 years – since 1945 (cumulative -12.7%). The consensus is for the economy to cut the contraction from 9.5% to 6% for the full year. A 6% contraction in 2020 would be in the worst 4% in 140-year history of US GDP.

So, we are witnessing one of the most expensive markets of all time (using the Shiller P/E ratio), while the economy is one of the worst we have ever seen. In theory, the stock market looks forward and can see through short-term issues. However, if it had such foresight, we wouldn’t have 30-to-40% short-term rallies and selloffs. History teaches us that the market is “bipolar” – it overshoots both up and down.
So, we are witnessing one of the most expensive markets of all time (using the Shiller P/E ratio), while the economy is one of the worst we have ever seen. In theory, the stock market looks forward and can see through short-term issues. However, if it had such foresight, we wouldn’t have 30-to-40% short-term rallies and selloffs. History teaches us that the market is “bipolar” – it overshoots both up and down.
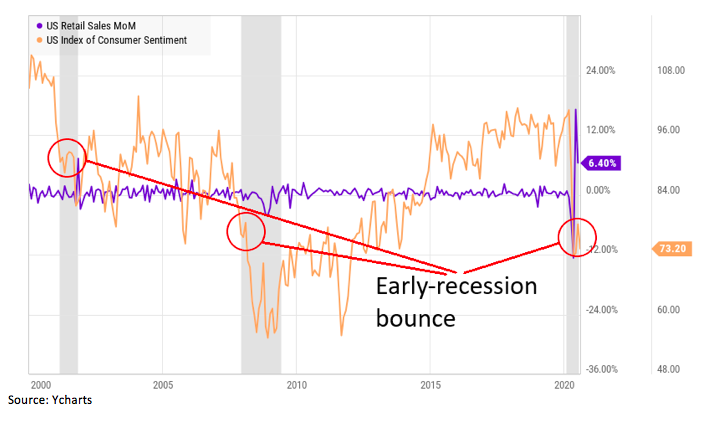
Today’s market is discounting an immediate and rapid V-shaped recovery. This is the most optimistic, best-case scenario – and there’s a chance that it, in fact, happens. But there are serious challenges to re-accelerating the economy after such a severe recession. To name just two, Congress might have created a 30-million permanent “unemployed class” that might be difficult to get back to work. Also, consumer sentiment – which typically leads spending – weakened in July and August after a bounce in June that now looks very similar to previous “early-recession bounces” – see chart above.
To be clear, I don’t know (as doesn’t anyone) the shape of the future recovery – V, L, W or whatever shape it may be. But pricing-in a V-shaped recovery with certainty seems dangerously overconfident. It’s as though market participants forgot about risk.
It is probably true that fundamentals matter less now. But the market always eventually reverts to fundamentals. To argue otherwise is to ignore the lessons of all the great bubbles. The market will likely need a catalyst in order to turn. Although no one knows how this actually happens, three candidates come to mind (so far ignored), each of which could serve as a negative catalyst: a stalemate about the second stimulus package, President Trump’s lag in the polls, and rising tensions with China.
About Model Capital Management LLC
Model Capital Management LLC (“MCM”) is an independent SEC-registered investment advisor, and is based in Wellesley, Massachusetts. Utilizing its fundamental, forward-looking approach to asset allocation, MCM provides asset management services that help other advisors implement its dynamic investment strategies designed to reduce significant downside risk. MCM is available to advisors on AssetMark, Envestnet, and other SMA/UMA platforms, but is not affiliated with those firms.
Notices and Disclosures
- This research document and all of the information contained in it (“MCM Research”) is the property of MCM. The Information set out in this communication is subject to copyright and may not be reproduced or disseminated, in whole or in part, without the express written permission of MCM. The trademarks and service marks contained in this document are the property of their respective owners. Third-party data providers make no warranties or representations relating to the accuracy, completeness, or timeliness of the data they provide and shall not have liability for any damages relating to such data.
- MCM does not provide individually tailored investment advice. MCM Research has been prepared without regard to the circumstances and objectives of those who receive it. MCM recommends that investors independently evaluate particular investments and strategies, and encourages investors to seek the advice of an investment adviser. The appropriateness of an investment or strategy will depend on an investor’s circumstances and objectives. The securities, instruments, or strategies discussed in MCM Research may not be suitable for all investors, and certain investors may not be eligible to purchase or participate in some or all of them. The value of and income from your investments may vary because of changes in securities/instruments prices, market indexes, or other factors. Past performance is not a guarantee of future performance, and not necessarily a guide to future performance. Estimates of future performance are based on assumptions that may not be realized.
- MCM Research is not an offer to buy or sell or the solicitation of an offer to buy or sell any security/instrument or to participate in any particular trading strategy. MCM does not analyze, follow, research or recommend individual companies or their securities. Employees of MCM may have investments in securities/instruments or derivatives of securities/instruments based on broad market indices included in MCM Research.
- MCM is not acting as a municipal advisor and the opinions or views contained in MCM Research are not intended to be, and do not constitute, advice within the meaning of Section 975 of the Dodd-Frank Wall Street Reform and Consumer Protection Act.
- MCM Research is based on public information. MCM makes every effort to use reliable, comprehensive information, but we make no representation that it is accurate or complete. We have no obligation to tell you when opinions or information in MCM Research change.
- MCM DOES NOT MAKE ANY EXPRESS OR IMPLIED WARRANTIES OR REPRESENTATIONS WITH RESPECT TO THIS MCM RESEARCH (OR THE RESULTS TO BE OBTAINED BY THE USE THEREOF), AND TO THE MAXIMUM EXTENT PERMITTED BY LAW, MCM HEREBY EXPRESSLY DISCLAIMS ALL WARRANTIES (INCLUDING, WITHOUT LIMITATION, ANY IMPLIED WARRANTIES OF ORIGINALITY, ACCURACY, TIMELINESS, NON-INFRINGEMENT, COMPLETENESS, MERCHANTABILITY AND/OR FITNESS FOR A PARTICULAR PURPOSE).
- “Model Return Forecast” for 6-month S&P 500 return is MCM’s measure of attractiveness of the U.S. equity market obtained by applying MCM’s proprietary statistical algorithm and historical data, but is not promissory, and, by itself, does not constitute an investment recommendation. Model Return Forecasts were calculated and applied by MCM to its research and investment process in real time beginning from 2012. For periods prior to Jan 2012, the results are “back-tested,” i.e., obtained by retroactively applying MCM’s algorithm and historical data available in Jan 2012 or thereafter. Source for the S&P 500 actual returns: S&P Dow Jones.
- Index returns referenced in MCM Research, if any, are gross of any advisory fees, fund management fees, and trading expenses. Fund or ETF returns referenced, if any, are gross of advisory fees and trading expenses. Returns will be reduced by fees and expenses incurred.