

By Doug Sandler, Chris Konstantinos & Rod Smyth, RiverFront Investment Group
The chart below may help to explain the dichotomy we find ourselves in. The decline in the price of the S&P 500 since October has been similar in magnitude to the declines in 2011 and 2015/16, shown above by the green circles (the percentage declines are from peak to trough, which in the current case thus far, was the low on Christmas eve). The index dipped very briefly below our bottom trend-line in 2011 in October 2011, before snapping back, and did the same this time. Friday’s rally back above 2500 has brought it back above the trend. Should stocks continue to rally, the next major test, in our view, will be the falling 200-day moving average, currently around 2700 (the red line in the chart below).

Both times a potential threat to the secular expansion of earnings and economic growth caused investors to build the possibility of a more serious earnings recession into the price of the index. The 2011 example was resolved in a single 19% decline and proved unjustified given that earnings continued to grow in 2011 and 2012. The 2015/16 pullback came in two waves, and although earnings did decline it was only slightly (less than 1%).
The S&P has once again traded down from the top of its upward sloping trading band to the bottom. Our base case scenario, as presented in RiverFront’s 2019 Outlook: Crossroads[1] assumes that the area near the bottom of the trading band will act as support just as it did on both previous occasions. (The blue trend lines are drawn using RiverFront’s best judgement).
We think it will take positive news on the trade war with China and the perception that the Fed is not going to overdo rate hikes to allow our base case 2019 Outlook to play out. In our view, Friday’s reversal of Thursday’s pessimism was related to traders’ perception that there was progress on both fronts and was encouraging to us.
In our pessimistic case we think it will take more time and lower lows before a sustainable uptrend begins. As we argue in our Outlook, this is a time for flexibility. As a result, we have positioned our balanced portfolios in what we believe is a relatively neutral stock/bond/cash mix, ready to move either way when we have greater conviction. As always, there is a spirited debate within the team, and we have portfolio investment scenarios for each outcome.
Lots of Jobs
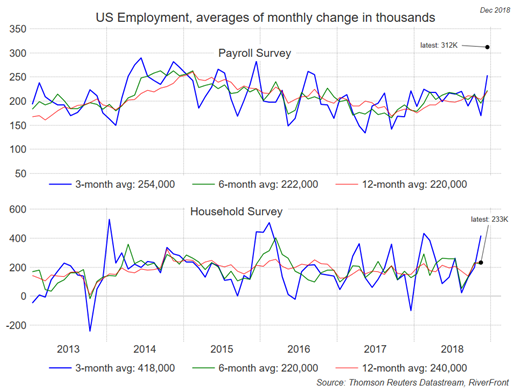
In a week when surveys of US companies showed a less confident manufacturing sector, and respondents in both China and the US reported a more cautious outlook for the Chinese economy, the stock market welcomed a strong jobs report, shown in the chart to the right. We always encourage investors to focus on the 12-month moving average which has been very stable over the last two years.
Past performance is no guarantee of future results. Shown for illustrative purposes only and not indicative of RiverFront performance.
US Fed Chair Powell “found the right notes” for stock investors in a speech on Friday subsequent to all the data. Stocks peaked in October when Powell stated that he thought interest rates had a long way to rise to get to neutral. On Friday he suggested the Fed could pause its rate hikes. “As always, there is no preset path for policy,” Powell said. “And particularly with muted inflation readings that we’ve seen coming in, we will be patient as we watch to see how the economy evolves.” He held up the Yellen Fed’s dovish approach in 2016 as an example of good policymaking (a first) and emphasized patience, a commitment to risk management, flexibility on both rates and the balance sheet and a willingness to pivot aggressively if needed. We believe a flexible Fed is what investors want at this stage, not one determined to raise rates to a predetermined target level, and that played a significant role in Friday’s rally.
At RiverFront, we always place importance on investor time frames. We think it is appropriate for longer time-frame investors (7-10 years) to remain fully invested and shorter time-frame investors (3-5 years) to be more balanced, looking for the right opportunity to add a little more risk.
Doug Sandler, CFA, is Global Strategist; Chris Konstantinos, CFA, is Chief Investment Strategist; and Rod Smyth is Director of Investments at RiverFront Investment Group, a participant in the ETF Strategist Channel.
[1] RiverFront’s 2019 Outlook: Crossroads describes RiverFront’s predictions for 2019 using three scenarios (pessimistic, base and optimistic). The assessment is based on RiverFront’s Investment Team’s views and opinions as of the date of publication of the Outlook. These views are subject to change and are not intended as investment recommendations. There is no representation that an investor will or is likely to achieve positive returns, avoid losses or experience returns as discussed for various market classes.
Important Disclosure Information
The comments above refer generally to financial markets and not RiverFront portfolios or any related performance. Past results are no guarantee of future results and no representation is made that a client will or is likely to achieve positive returns, avoid losses, or experience returns similar to those shown or experienced in the past.