

By Ryan O’Malley, Vice President, Fixed Income Portfolio Strategist
Just six months into 2022, the tone of conversation about risk assets has taken a turn for the worse. Equity markets have seen a drawdown of over 20% from the peak, officially placing major U.S. indices in a bear market. The Federal Reserve has attacked inflation by hiking rates at the most aggressive pace in decades, and fixed income investors have shared the pain. Both interest rates and credit spreads have increased, crushing fixed income returns. Naturally, this progression wider in spreads has caused concern over the potential for increasing defaults, particularly in the high yield, or “junk bond,” market.
Less than one year ago, on July 6, 2021, the Bloomberg High Yield Index Option-Adjusted Spread (OAS) hit a multi-year low of 2.62%. As of market close on June 23, that number had more than doubled to 5.25%. While this level is not atypical over the long run, some of the more volatile parts of the market have shown real signs of stress.
CCC-rated bonds are the riskiest portion of the high yield index and today comprise about 12% of all high yield bonds. Last week, the BAML CCC Index saw spreads breach 1,000 basis points (bps) for the first time since the early days of the Covid pandemic.
The CCC Index weighted average spread is 1,000 bps, a level generally considered “distressed.”
BAML CCC Index – Spread to Worst (bps)
Source: Sage, Bloomberg
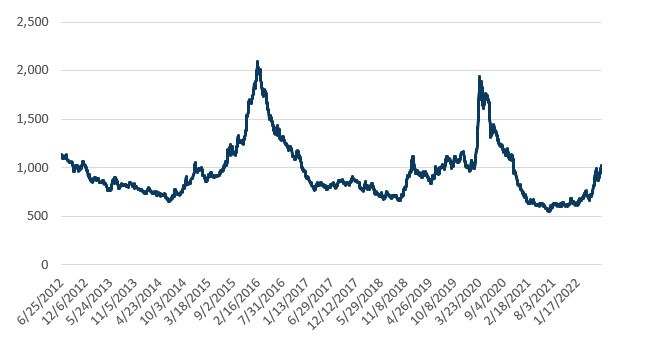
This 1,000 bps, or 10% spread level, is generally considered the level consistent with “distress” or where creditors begin to wonder whether their bonds will be paid back in full.
To be sure, the entire CCC Index is not quite at this level. It has been estimated by Wall Street banks that only 7% of issuers actually trade at this level currently, as a few outliers have driven the larger weighted average much wider than the median credit.
While high yield bond prices clearly show signs of worry from investors, default rates have remained historically low so far, around 0.5% for the High Yield Index. With the prospect of a recession rearing its ugly head, defaults seem certain to increase, but by how much?
It’s worth mentioning that companies typically resist defaulting at all costs, since it can often lead to a change in management teams and reputational loss.
What makes an issuer default?
What causes a company to finally give in and default? In the simplest terms, it’s often a short-term cash flow imbalance that is the final straw. Market analysts will often point to increasing leverage or lower interest coverage as signs of a deteriorating credit, but the trigger for a default is often an upcoming debt maturity or major coupon payment that the company simply does not have the excess cash on hand to pay. Usually, these issuers have been “stressed” for several years before this decision is made, as the treatment of equity in bankruptcy is often dire and something company management wants to avoid at all costs.
Two recent examples of long-suffering credits that finally broke are Revlon and Talen Energy.
Revlon has operated out of New York for over 90 years. Billionaire Ron Perelman took a controlling stake in the company in 1985 and has consistently ridden to the rescue when Revlon’s poor financial results made investors uneasy. The pandemic was particularly rough on Revlon’s end markets, and the company had posted five straight years of negative free cash flow (FCF) as of year-end 2021.
Revlon has managed to avoid default many times since Perelman’s purchase but faced with the decision of whether or not to make nearly $49 million in short-term debt interest payments, company management decided to restructure under a new capital structure.
Revlon had $3.5bn in total debt, while producing $300 million in EBITDA during 2021, for a gross leverage number of 11.7 turns. More importantly, years of negative free cash flow meant that the company had scant liquidity to service its $241 million in annual interest costs. With prospects for the base business unlikely to improve to a level that would justify carrying its levered balance sheet into a new year, the company decided to seek bankruptcy protection and quickly reorganized its debt burden into a more sustainable structure.
Talen Energy is much less likely to be familiar to casual market observers, but the cause of its demise is something that nearly everyone in the Southwest U.S. can remember from early 2021. Talen is an independent power producer; the company attempts to sell power into unregulated markets like Texas at premium prices when demand exceeds what regulated utilities can source at reasonable levels. Winter Storm Uri hit much of the Southwest U.S. in early 2021, causing a huge spike in natural gas prices.
Power producers like Talen typically have a complex series of energy price hedges that assume certain ranges for commodity prices like natural gas, so when the price of power and natural gas exploded in a matter of days Talen had to post additional collateral or face a margin call. With nearly $4.5bn in debt to service at fairly high interest rates, this caused a cash mismatch that Talen simply could not satisfy. The company elected to declare bankruptcy and reorganize its debt rather than funding this cash imbalance in the face of uncertain prospects for the business.
Conclusion
There is not one single metric credit investors can point to that reliably predicts an impending default. Typically it is a cascade of events that plays out over years that causes issuers to seek bankruptcy protection.
Signs of increasing stress in credit markets are apparent, and the chance of a recession hitting the U.S. economy is very real in 2022. Credit metrics overall are deteriorating, but predicting default rates relies on a variety of variables.
The companies most likely to be materially affected are in the CCC space. As many as one-third or so of these companies could face real distress in the next 12 months, which could represent approximately 3% to 4% of the High Yield Index.
Defaults will increase from 0.5% of the index to perhaps as much as 4% to 5%, but given the smaller percentage of CCCs in the High Yield Index, stronger average balance sheets in the BB/B range compared to previous cycles, and less than $100bn or so of debt to refinance before year-end 2023, defaults may not be as dire as some would suspect assuming a full recession comes to fruition.
Disclosures
This is for informational purposes only and is not intended as investment advice or an offer or solicitation with respect to the purchase or sale of any security, strategy or investment product. Although the statements of fact, information, charts, analysis and data in this report have been obtained from, and are based upon, sources Sage believes to be reliable, we do not guarantee their accuracy, and the underlying information, data, figures and publicly available information has not been verified or audited for accuracy or completeness by Sage. Additionally, we do not represent that the information, data, analysis and charts are accurate or complete, and as such should not be relied upon as such. All results included in this report constitute Sage’s opinions as of the date of this report and are subject to change without notice due to various factors, such as market conditions. Investors should make their own decisions on investment strategies based on their specific investment objectives and financial circumstances. All investments contain risk and may lose value. Past performance is not a guarantee of future results.
Sage Advisory Services, Ltd. Co. is a registered investment adviser that provides investment management services for a variety of institutions and high net worth individuals. For additional information on Sage and its investment management services, please view our web site at www.sageadvisory.com, or refer to our Form ADV, which is available upon request by calling 512.327.5530.