

By Gary Stringer, Kim Escue and Chad Keller, Stringer Asset Management
We wrote a piece a year ago about tariffs and the potential economic implications of a trade war. Though details of tariff policies and the responses from affected countries were not clear at that time, we thought that the tariffs would have little economic impact based on available policy information.
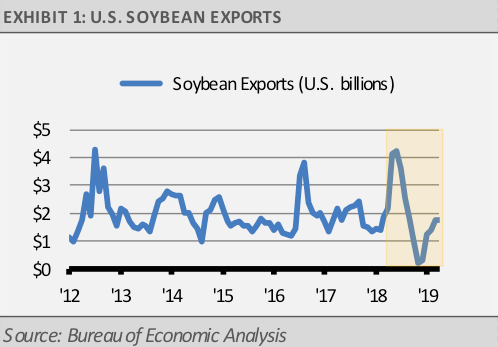
Now that we are a year into this new tariff regime, we can see some of the implications. For example, soybean exports spiked ahead of new tariffs, then collapsed. Soybean exports have now recovered to levels closer to historical norms, as you can see in the graph below. Further fluctuations in the agriculture space are as likely to be weather related as anything.
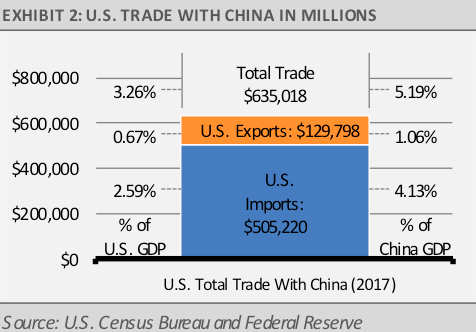
Regarding the current round of tariff escalations with China, we expect the economic implications to be limited and not helpful for either side. For example, total trade with China represents only 3.26% of U.S. GDP (imports 2.59%, exports 0.67%) and 5.19% of China’s GDP (imports: 1.06%, exports 4.13%), so the impact of tariffs and accompanying trade adjustments are likely to be minor compared to other more impactful influences. However, if we end up in a full global trade war, the playing field looks very different for each player and country.
How to Determine Who is at Risk
As a general framework, the countries that heavily rely on international trade are the most at risk in a global trade war. Though the details of how such an event might playout are not clear at this time, investors should consider the broad risk of a trade war to a country by examining their trade as a percentage of their economy. In doing so, it is important to consider both imports and exports since focusing only on exports ignores the benefits that countries receive through imports. For example, domestic consumers often benefit from imports by lower prices and a broader selection of goods and services than could be created only through domestic sources. A reduction in imports would likely result in higher prices and fewer choices for domestic consumers.
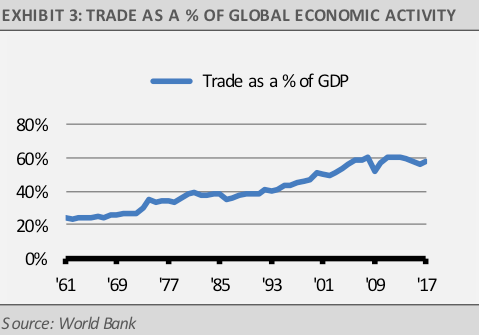
Trade as a percentage of the global economy has been steadily growing since 1960 but may have peaked a few years ago at more than 60% (exhibit 3). The latest figure of nearly 58% for calendar year 2017 represents a slight pullback but is still reflective of a globally integrated economic system.
If this trade system were to be disrupted through a global trade war or other phenomenon, certain countries would likely be more at risk than others. Fundamentally, the overall impact on the U.S. economy is likely to be minimal. Yes, the raw numbers look large, but all things must be taken into context. For example, the amount of trade relative to the size of the economy: exports make up just 12% of U.S. GDP while imports are 15% of GDP, so total trade (imports plus exports, and a good estimate of the total impact from trade frictions) accounts for 27% of U.S. GDP.
For China, exports account for 20% of GDP while imports are 17%, so 37% total trade relative to GDP. The average for the OECD is 28% each for exports and imports, so 56% total.
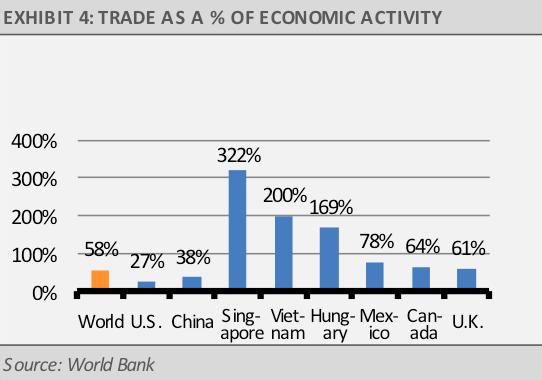
Clearly, the impact of trade frictions on the U.S economy would be less than the average OECD nation. The U.S. is just not a trading nation. In fact, among the OECD nations, measured as a % of GDP, no one trades less than we do. It seems like the market has been looking for a reason to sell off, but tariffs are not a fundamental risk for us. Other countries are even more exposed, such as Singapore at 322%, Vietnam at 200%, Hungary at 169%, Mexico at 78%, Canada at 64%, and the United Kingdom at 61%.
An Overview of GDP and Trade Figures
Obviously, trade is not a zero-sum game, so trade can represent more than 100% of their economy for some countries. Gross Domestic Product (GDP), which is a favored measure of economic activity, is calculated using the following five components: Consumption [plus]Investment [plus]Government Spending [plus]Exports [minus]Imports, or C+I+G+X-M. Consider a small country that has $1 billion of consumption, $1 billion of investment, and $1 billion of government spending. Next, we analyze their exports and imports. This country has a large factory that produces more goods than the country consumes, and exports $2 billion of goods. GDP is now $5 billion ($1B+$1B+$1B +$2B). The country uses that money from exports to import goods and services worth $2 billion. Imports are subtracted from GDP, so total GDP is again $3 billion ($5B – $2B).
What to Look for Next
In general terms, the larger the ratio of trade to the size of an economy, the more important trade is to the success of that economy. It makes sense then that the greater the proportion of trade is to an economy, the more vulnerable that economy is to a disruption in trade, such as a trade war. Of course, the size of the impact will be dependent on the nature of the trading relationships.
For example, though trade represents 64% of the Canadian economy, much of that trade is with the U.S. and is unlikely to be affected by a trade war. Other countries are likely to be more vulnerable. Based upon the facts as we know them today, we do not see a large-scale trade war in the future. More importantly, we do not think these tariff talks, and trade threats will cause a major disruption in the global economy. As we mentioned after the surprise Brexit vote and the following market selloff, the people who negotiate these deals understand their economic history and the importance of trade to economic wellbeing. Though markets may go through bouts of panic, we expect global trade to continue largely unabated and economic fundamentals to remain solid.
This article was written by Gary Stringer, CIO, Kim Escue, Senior Portfolio Manager, and Chad Keller, COO and CCO at Stringer Asset Management, a participant in the ETF Strategist Channel.
Disclosures
Any forecasts, figures, opinions or investment techniques and strategies explained are Stringer Asset Management, LLC’s as of the date of publication. They are considered to be accurate at the time of writing, but no warranty of accuracy is given and no liability in respect to error or omission is accepted. They are subject to change without reference or notification. The views contained herein are not be taken as an advice or a recommendation to buy or sell any investment and the material should not be relied upon as containing sufficient information to support an investment decision. It should be noted that the value of investments and the income from them may fluctuate in accordance with market conditions and taxation agreements and investors may not get back the full amount invested.
Past performance and yield may not be a reliable guide to future performance. Current performance may be higher or lower than the performance quoted.
The securities identified and described may not represent all of the securities purchased, sold or recommended for client accounts. The reader should not assume that an investment in the securities identified was or will be profitable.
Data is provided by various sources and prepared by Stringer Asset Management, LLC and has not been verified or audited by an independent accountant.