

By Gary Stringer, Kim Escue and Chad Keller, Stringer Asset Management
With the announcement of proposed tariffs, the global markets reacted with a sharp sell-off and increased volatility despite little details on the impact to the U.S. or other economies. Similar to most news, the baby is often thrown out with the bath water when it comes to the markets. It is not a surprise that after a protectionist themed campaign, the Trump administration would propose tariffs and open the stage for renegotiations of many long-term trade deals. What has yet to be seen is how the targeted countries will respond and, ultimately, where the negotiations will lead. Generally, like any negotiation, the intention and actual end result often do not completely align. Without much clarity at this point, we think as they are currently proposed, the tariffs will have little economic impact. However, if we do end up in a full trade war, the playing field looks very different for each player and country.
How To Determine Who Is At Risk
As a general framework, the countries that heavily rely on international trade are the most at risk in a global trade war. Though the details of how such an event might playout are not clear at this time, investors should consider the broad risk of a trade war to a country by examining their trade as a percentage of their economy. In doing so, it is important to consider both imports and exports since focusing only on exports ignores the benefits that countries receive through imports. For example, domestic consumers often benefit from imports by lower prices and a broader selection of goods and services than could be created only through domestic sources. A reduction in imports would likely result in higher prices and fewer choices for domestic consumers.
Related: The Road Ahead – 3 Keys To Navigating Volatile Markets
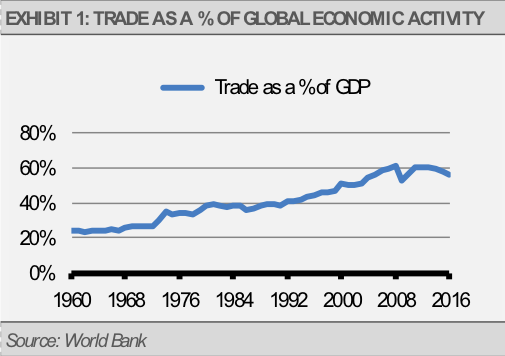
Trade as a percentage of the global economy has been steadily growing since 1960 but may have peaked a few years ago at more than 60% (exhibit 1). The latest figure of 56% for calendar year 2016 represents a slight pullback but is still reflective of a globally integrated economic system.
![]()
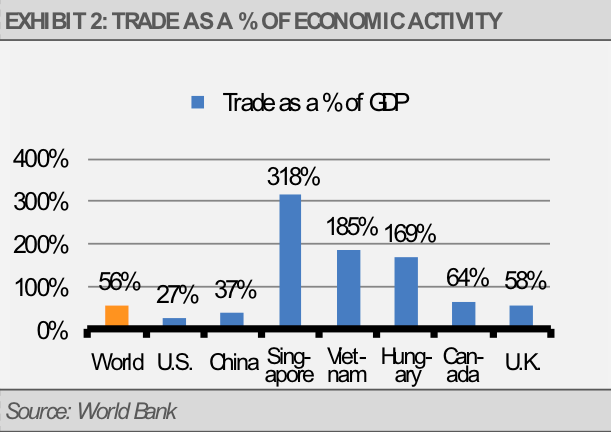
If this trade system were to be disrupted, through a global trade war or other phenomenon, certain countries would likely be more at risk than others. For example, total trade represents 27% of economic activity for the U.S., compared to 37% for China, which is often seen as a target of U.S. trade policy. Other countries are even more exposed, such as Singapore at 318%, Vietnam at 185%, Hungary at 169%, Canada at 64%, and the United Kingdom at 59% (exhibit 2).
AN OVERVIEW OF GDP AND TRADE FIGURES
Obviously, trade is not a zero-sum game, so trade can represent more than 100% of their economy for some countries. Gross Domestic Product (GDP), which is a favored measure of economic activity, is calculated using the following five components: Consumption [plus]Investment [plus]Government Spending [plus]Exports [minus]Imports, or C+I+G+X-M.