

This week instead of celebrating a holiday, we are celebrating an anniversary. On April 1st, 2018, TETF.index turned one year old while returning over 36%. So, the natural question we want to ask is this – How close does the TETF.index track the growth of the ETF industry and what can we learn?
Much is written about the Industry’s growth from a variety of sources and studies. But since the Index is only 1 year old, our sample data set is small and now is the time to start tracking the thesis. The chart below superimposes the returns of the Index over the percentage change in the US ETF assets. The correlation is apparent.
1 YEAR CUMULATIVE GROWTH TETFINDEX VS US ETF ASSETS

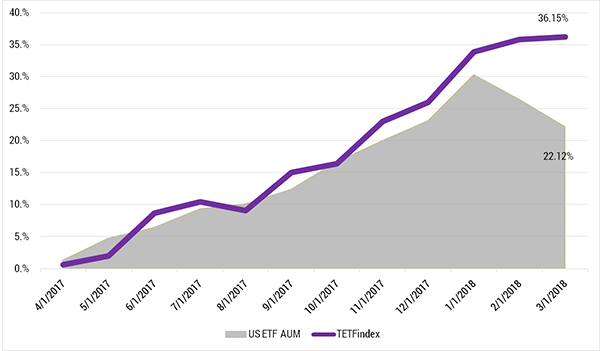
In the past 12 months, US ETF assets have grown by $620 billion or 22%. It appears the public equity markets are anticipating more growth since the constituents of TETF.index have outperformed the rise in assets. Below, we look at the 1-year growth of some the top public issuers:
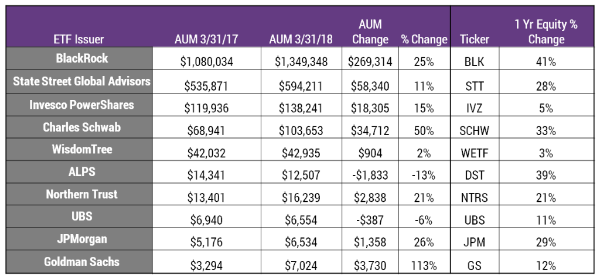
Source: etf.com
As you can see, there is consistent growth across most of the companies. Both Charles Schwab and Goldman Sachs showed an extraordinary increase in assets, which is surprising considering they sponsor less than 30 ETFs combined. Another interesting data point is the correlation of Wisdom Tree’s performance to its assets.
We also looked at the top flows by ETF category over the past year. The data supports the thesis that most ETF growth comes from the client alignment factor of low fees. IEFA is the largest winner with an expense ratio of 0.08% with is substantially lower than iShares’ similar fund EFA with an expense ratio of 0.32%.
Top 1 Year Flows
![]()